Examples guide
The example apps in src/examples/ show ComposeUI’s features in
complete apps. This guide says what each example shows, and how to run it. Each section
has a screenshot of the example on each backend that shows it. The
user guide explains each feature. The examples are not in the wheel:
run them from a clone of the repository.
Contents
Run an example
Clone the repository, and install in it the extras of the backends that you want (see the README). Then run an example as a module:
uv run python -m examples.pipeform --backend qt
--backend takes qt, textual, or web. Without --backend, the COMPOSEUI_BACKEND
environment variable picks the backend. Without both, each example starts its own default
backend, which the overview gives. --help lists the other
options, such as --language and -f FILE.
Overview
Example |
Default backend |
Shows |
|---|---|---|
web |
Forms, validation, pages, a menu, a confirm dialog, Markdown help, a French translation |
|
web |
A Markdown view, a file path input, an option of the app’s own, no File menu |
|
web |
A table of a study’s files: paths picked by each row’s kind, relative to the study’s folder; a summary saved after asking before replacing a file |
|
web |
Jobs in threads, metrics, a progress bar, a step chart, an expander, a button and a link in a table’s cells, a French translation |
|
qt |
Line and scatter charts, a reference line, tabs, a table, check boxes and comboboxes in a table’s cells, colored, marked and disabled cells, cells spanning rows, a header group, row headers |
|
web |
A SQLite model, a sidebar, a list of views, a tree, resizable panes, a form dialog, a date input |
|
web |
A job writing to a SQLite model, a progress bar, a line chart and a table on tabs, a French translation |
|
qt |
A large table of a million rows in SQLite, read as they show, sorted by a click on a header, searched and filtered in its bar, exported as CSV |
|
web |
A CSV URL loaded into SQLite by a loading task, a bar chart, a street map filtered by a slider in a sidebar, a large table |
|
web |
The Uber pickups app on a Polars frame instead of SQLite: a large table of a dataframe |
|
qt |
Series colors, fills, and clicks on a chart |
|
web only |
A form on the web backend, built with |
|
textual |
A small form in a terminal |
The tests in tests/ also run these examples, as
Testing your app shows. When you change an example, run its tests.
Where to start
Read the examples in this order. Each one adds a few features to the ones before it:
Pipe form: forms and their checks, pages, menus, and a translation. It follows Building views of the user guide.
Markdown viewer: a small app without studies, with a command-line option of its own.
Task view: jobs in threads, with their progress.
Pipe chart: charts, tabs, and the widgets in the cells of a table.
Pipe catalogue: a SQLite model, with the views that follow it.
Pipe sweep: a job that writes to a SQLite model.
The other examples each show one topic:
Large table: a million rows of SQLite in a large table.
Uber pickups: a CSV download in a loading task, a bar chart, and a map.
Uber pickups on a dataframe: the same app on a dataframe, in a large table.
Batman: the look of a chart, and clicks on it.
Web hello: an app that only the web shows.
Textual demo: an app in a terminal.
Pipe form
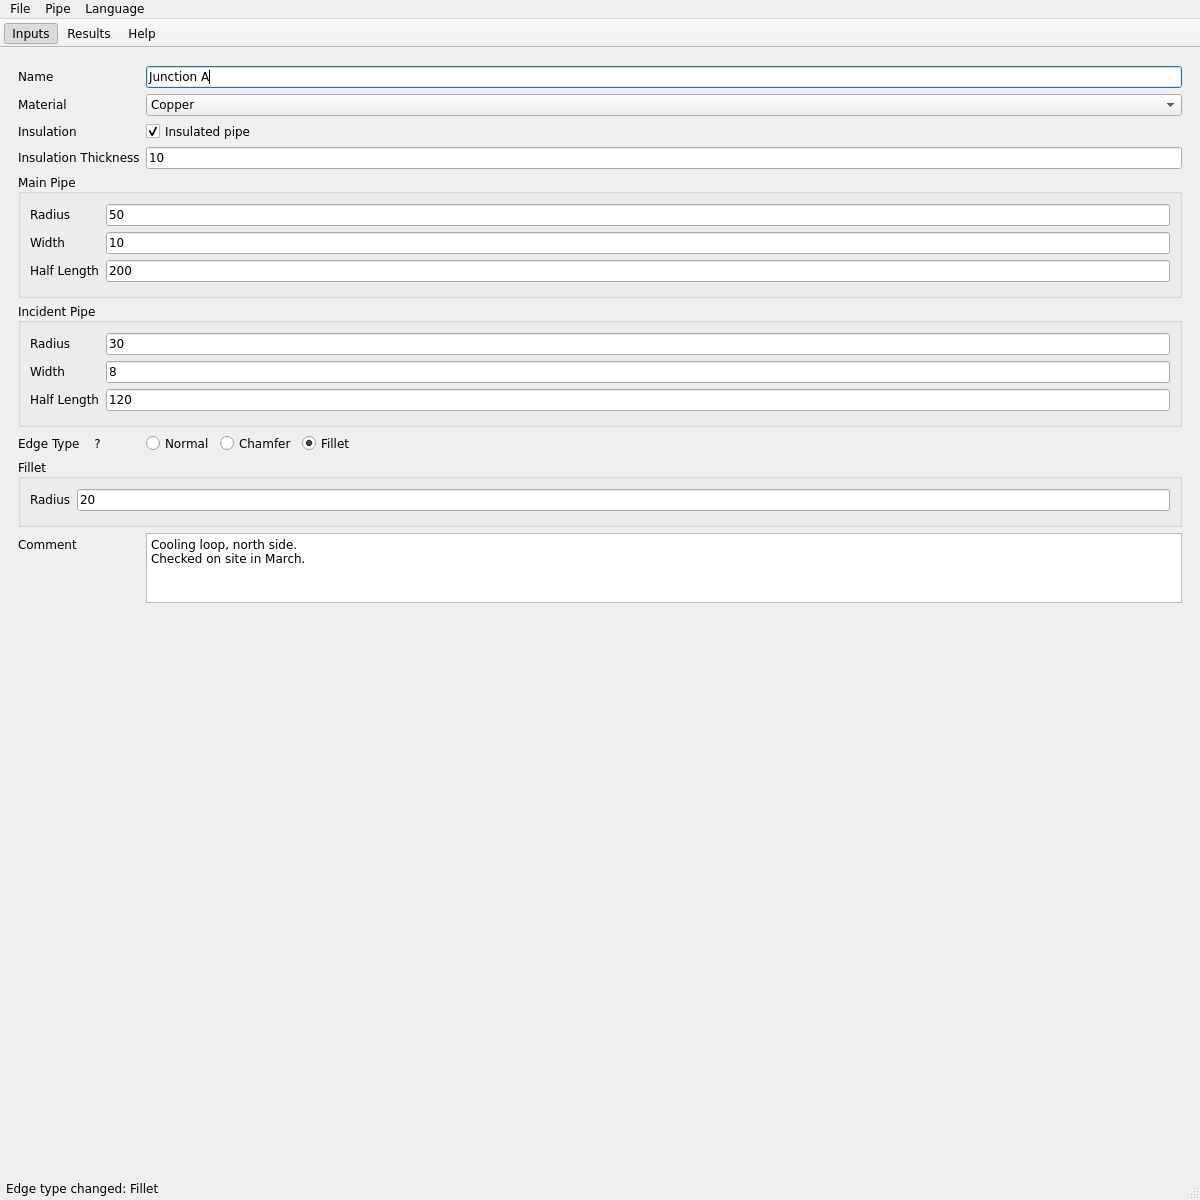
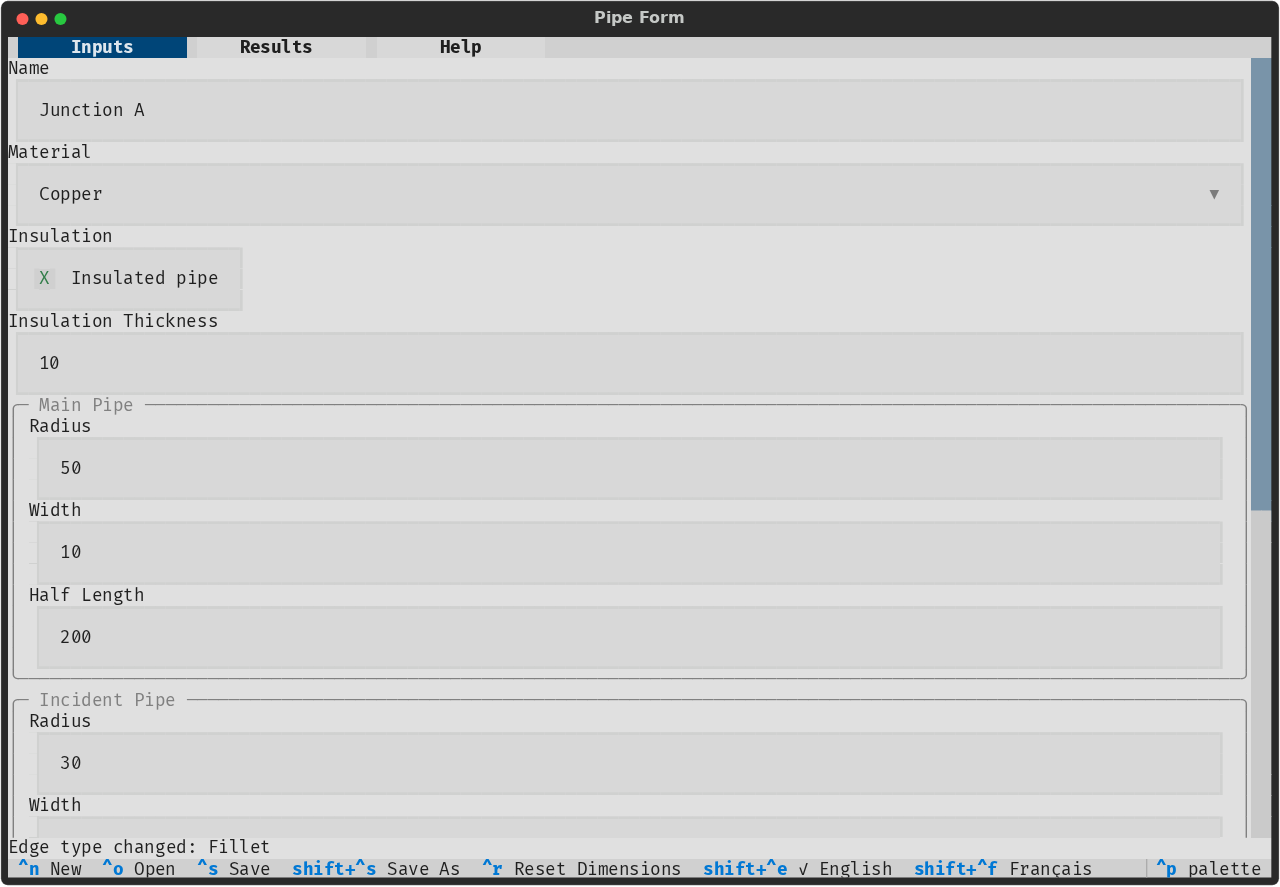
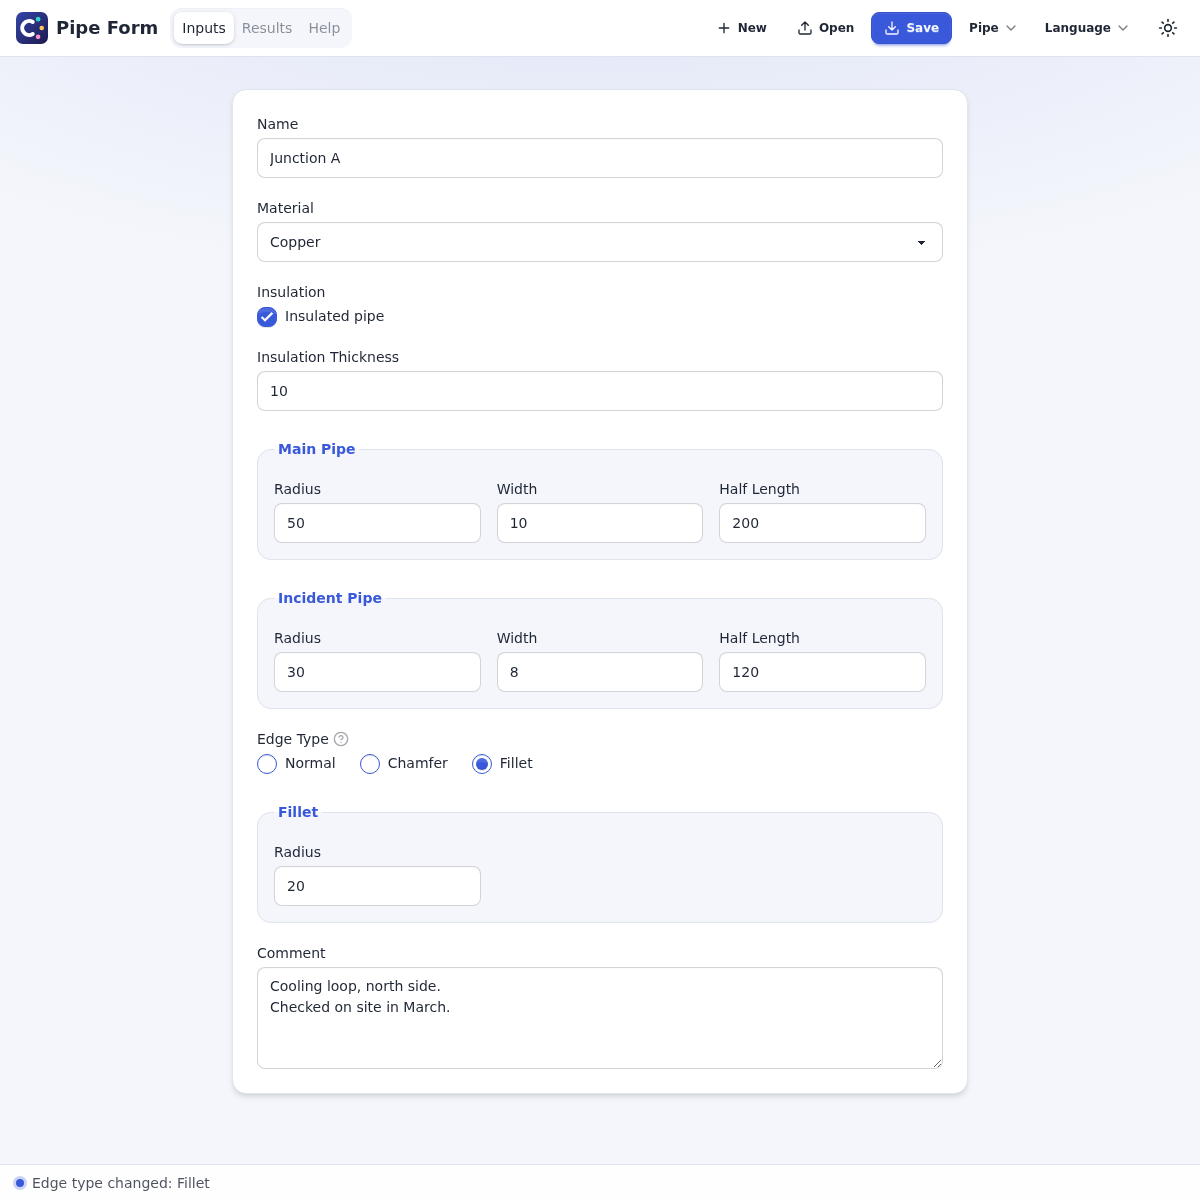
pipeform.py is a form that describes two pipes: a main pipe
and an incident pipe.
uv run python -m examples.pipeform # web; or --backend qt, or textual
On Qt:
On Textual:
On the web:
It shows:
forms with labelled rows: text, float inputs, a checkbox, radio groups, a combobox, and a comment of several lines;
validation on a row, such as the name, and across rows, such as a main pipe that must fit the incident pipe;
three pages: Inputs, Results (a read-only table of the dimensions), and Help (a Markdown page);
a Pipe menu, whose Reset Dimensions asks for a confirmation first;
the File menu, which saves and loads the study as a
.pipefile;a French translation and a Language menu. To start in French, add
--language fr.
Markdown viewer
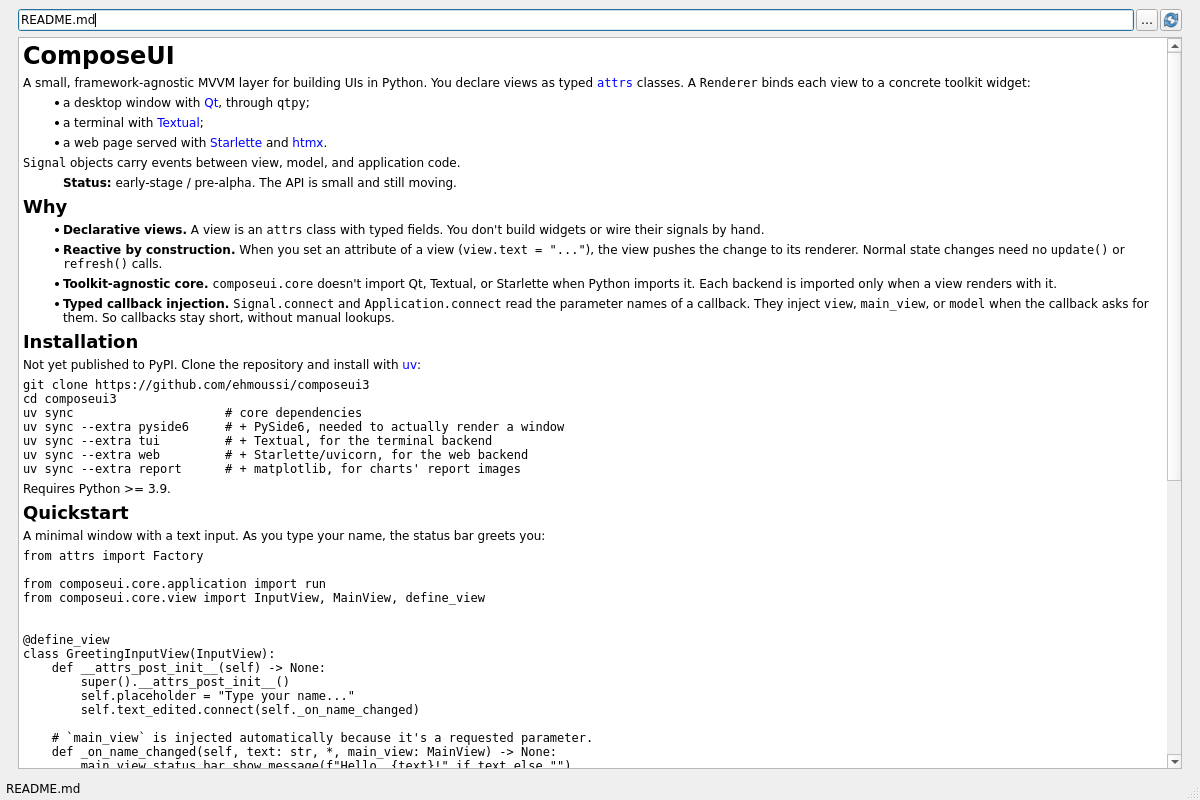
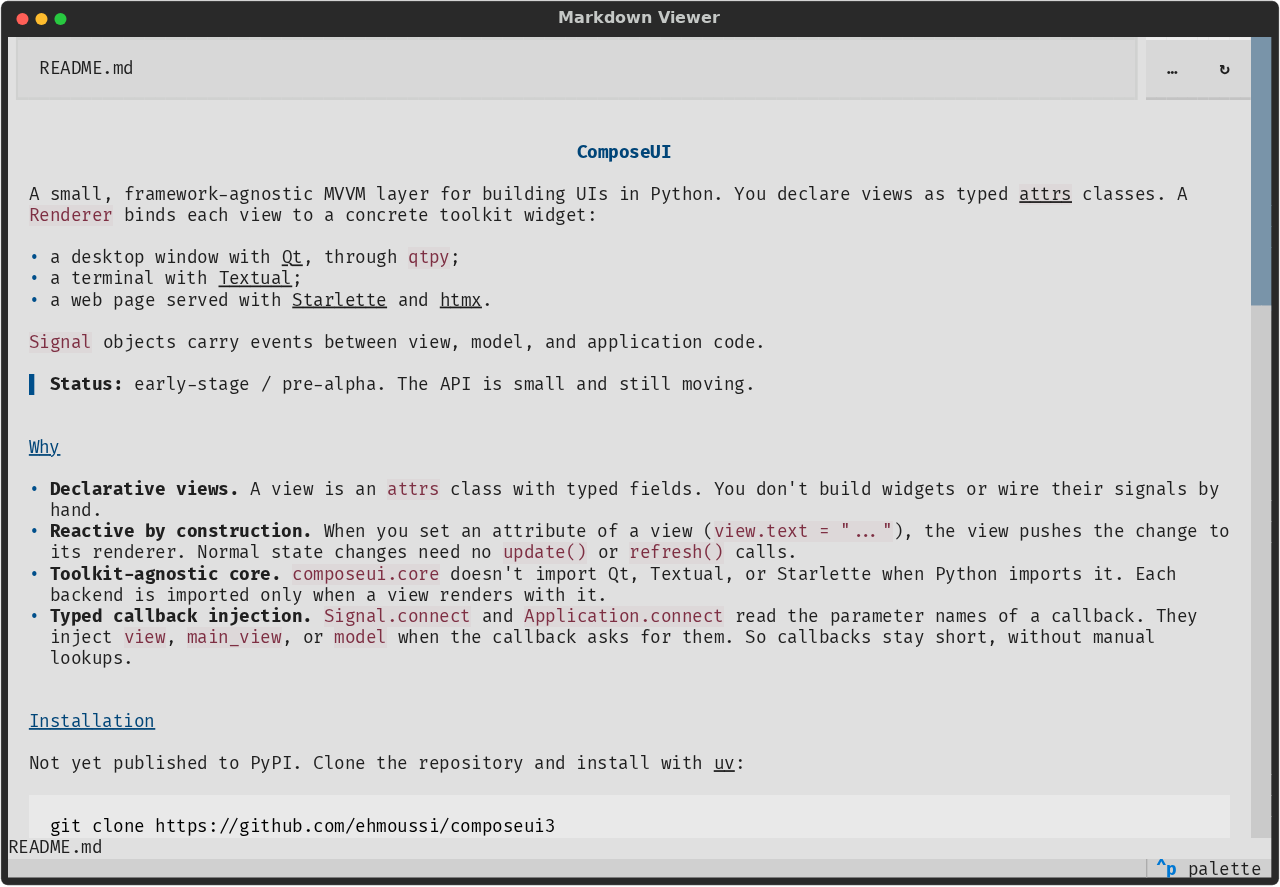
markdownviewer.py shows a Markdown file.
uv run python -m examples.markdownviewer --markdown README.md --backend qt
On Qt:
On Textual:
On the web:
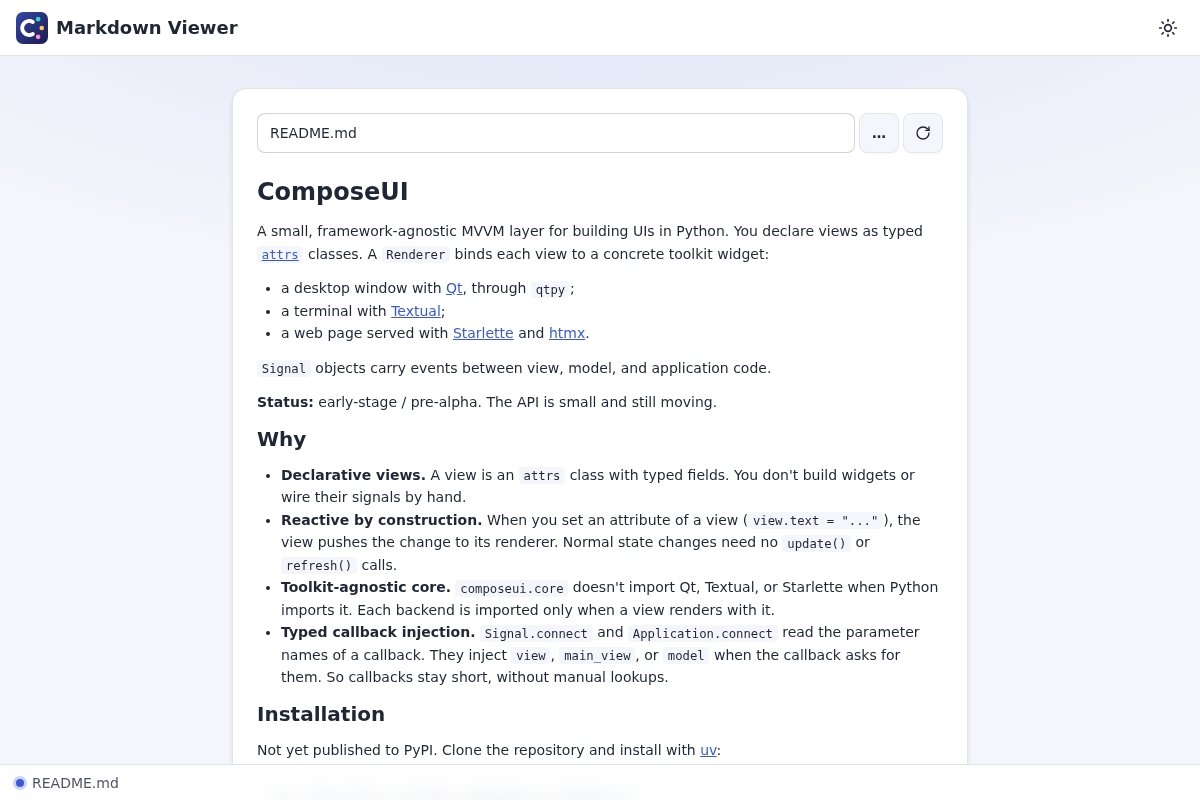
It shows:
an option of the app’s own:
--markdown, beside the options of the backend;a file path input at the top: the user types the path of a file, or picks the file with the “…” button. On the web, the browser uploads it. The reload button reads the file again, for example after the user edits it.
an app without studies:
has_file_menu = Falseleaves out the File menu.
Study inputs
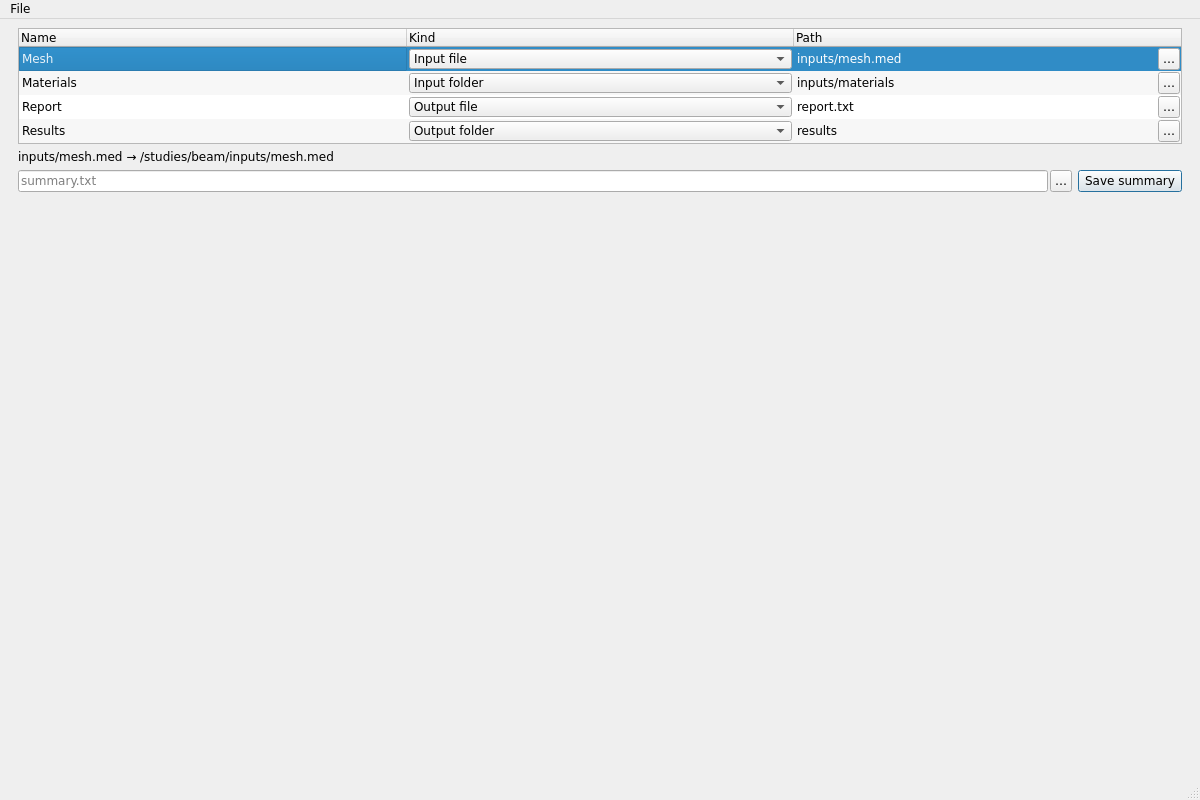
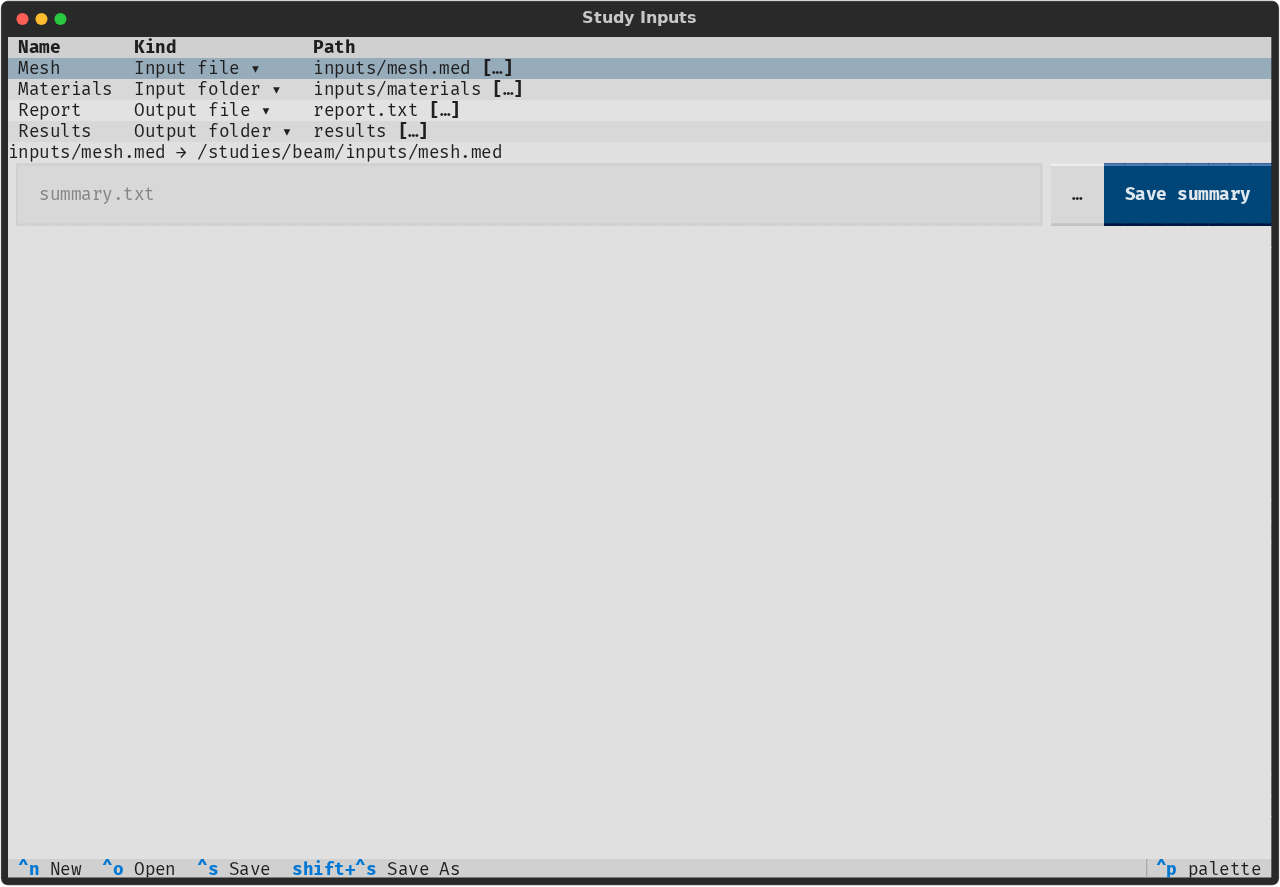
studyinputs.py lists the files and folders of a study,
which the study reads or writes.
uv run python -m examples.studyinputs --study ~/studies/beam --backend qt
On Qt:
On Textual:
On the web:
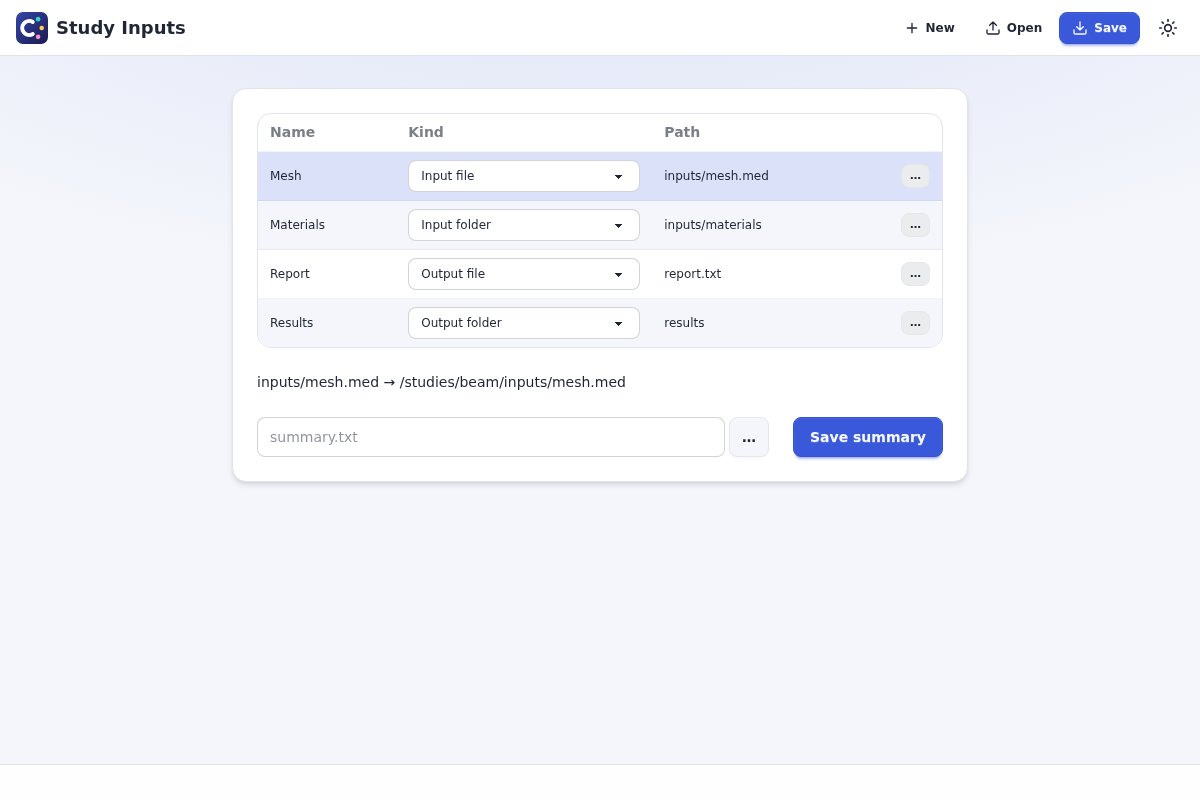
It shows:
a table with a combobox of each row’s kind: an input file, an input folder, an output file, or an output folder;
paths by the row’s kind: the “…” button of a row’s path picks a file, a folder, or a file to write, as its kind says. When the user changes the kind, the button follows. An output file may not exist yet, and picking one that exists asks first.
relative paths: the paths start from the study’s folder,
--study, whatever folder the app started in. The line under the table shows where the selected row’s path leads (cell_widget(row, column).path(text)).on the web, the “…” button lists the study’s folder: its
server_roots.“Save summary” writes the table’s rows to the text file of the save path input beside it. Over a file that exists,
write_fileasks first, unless the user already agreed in the field’s “…” picker.
Task view
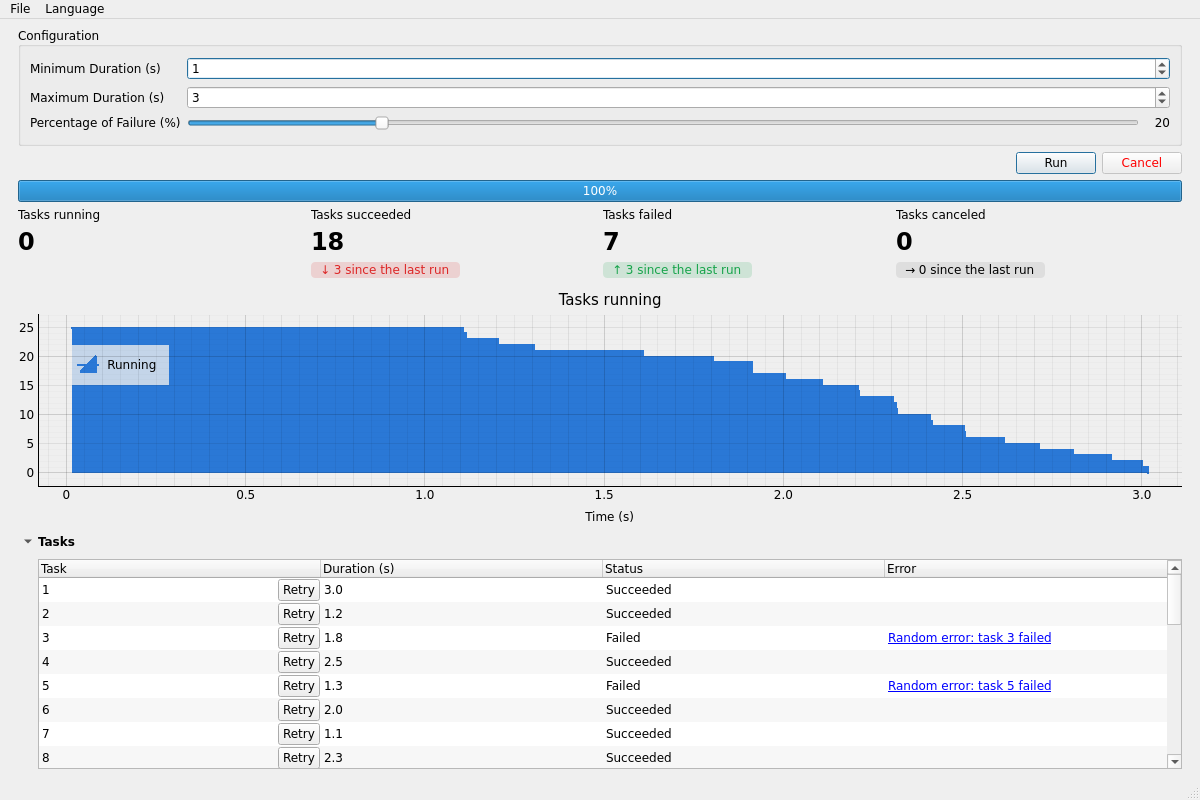
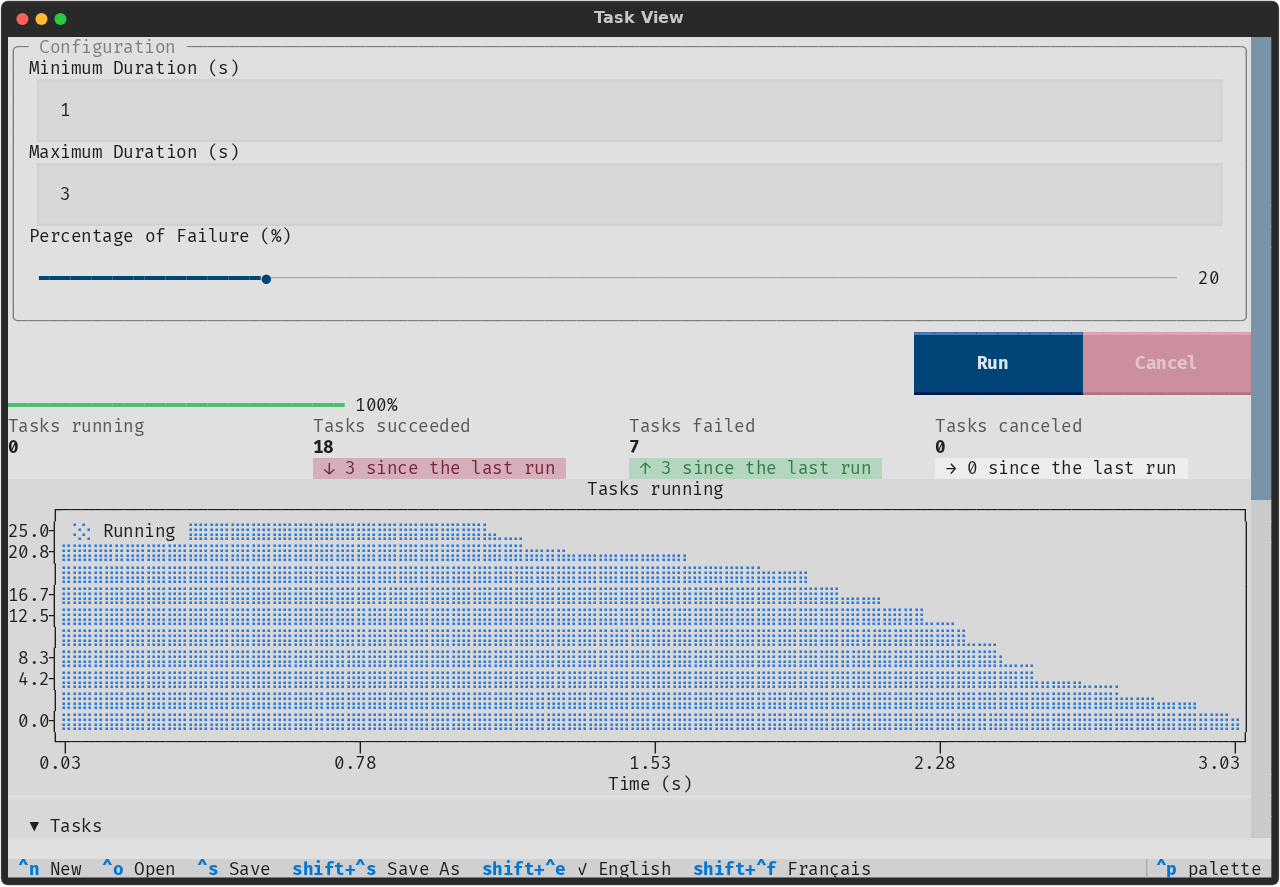
taskview.py runs 25 tasks side by side in threads.
uv run python -m examples.taskview # web; or --backend qt, or textual
On Qt:
On Textual:
On the web:
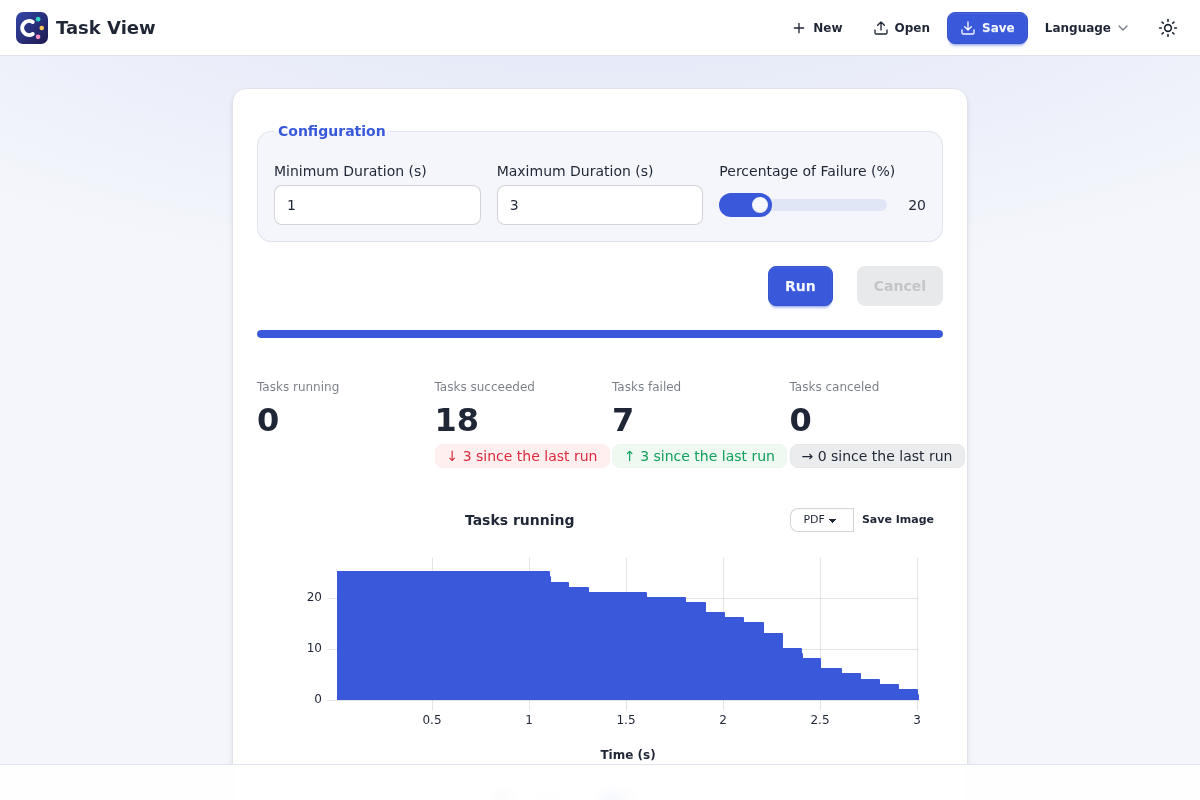
It shows:
jobs: each task is a function that runs in a thread and never touches a view. Its job emits the status of the task on the main thread, where the views show it. A button cancels the jobs.
a configuration form with an integer input and a slider;
a progress bar of the tasks done;
metrics that count the tasks. Once a run is over, they show how each count changed since the last run.
a step chart of the tasks running over the time of the run;
an expander with the table of the tasks, which collapses to leave only the metrics and the chart;
widgets in cells: the Retry button of a task runs it again. The error of a failed task is a link that opens a dialog with its details.
a French translation and a Language menu.
Pipe chart
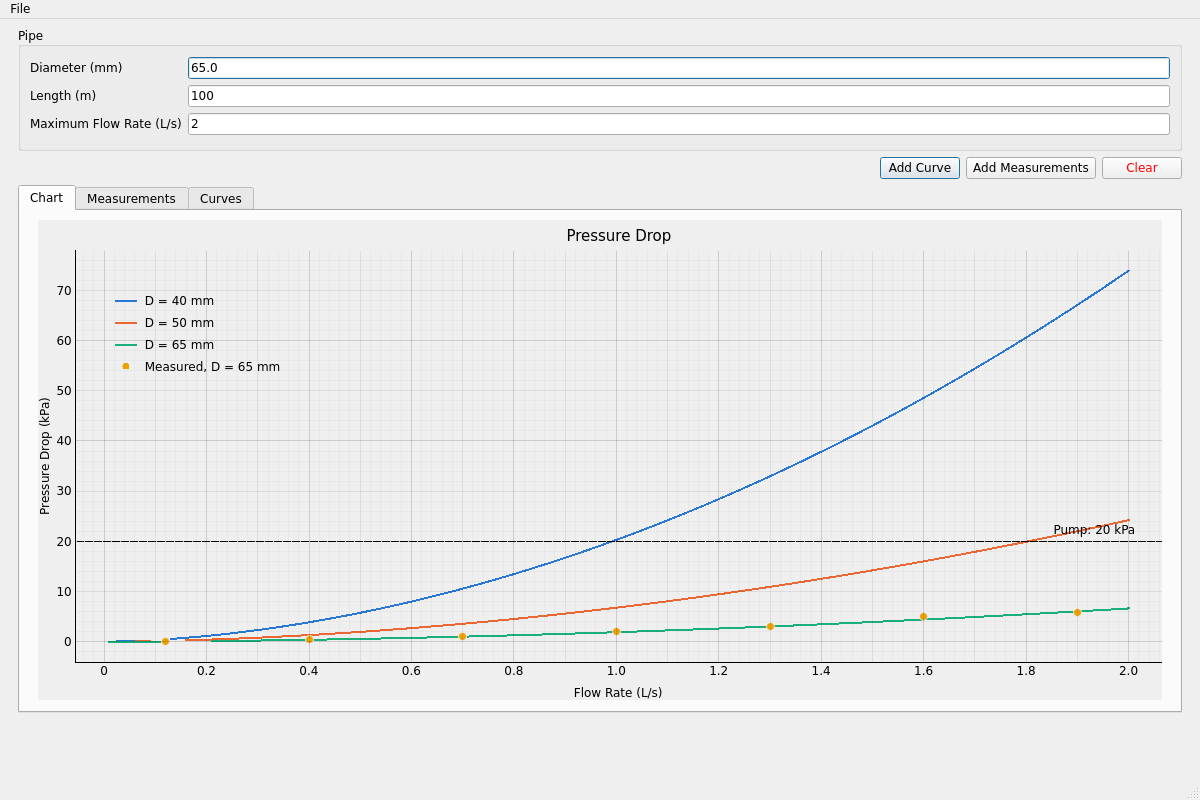
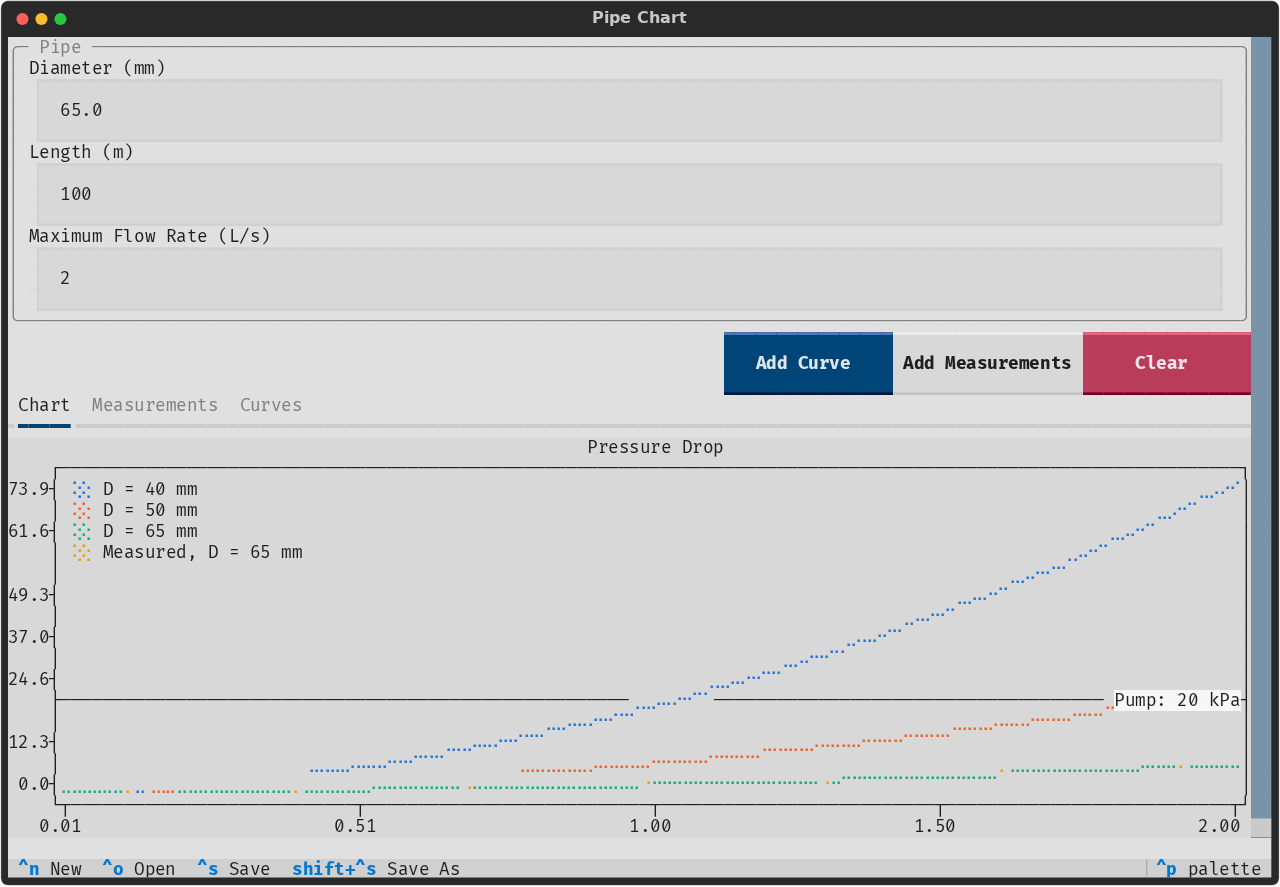
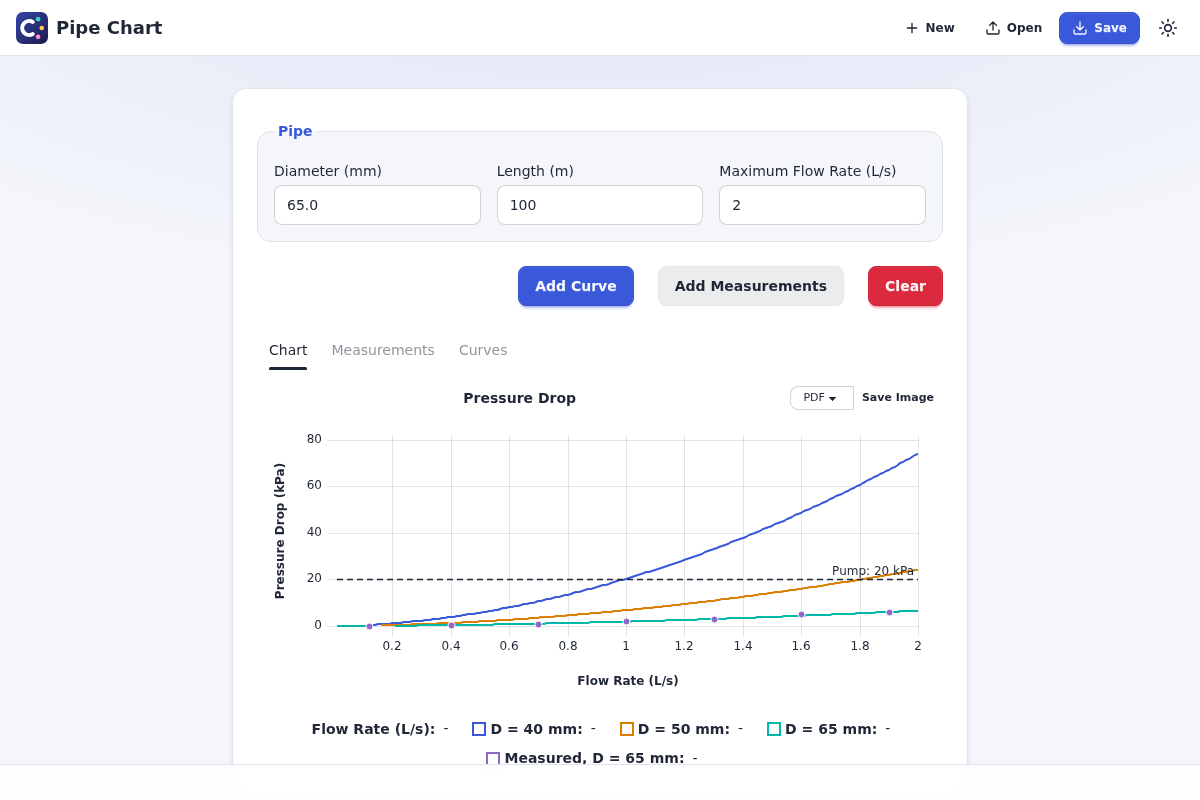
pipechart.py plots the pressure drop of a pipe against its
flow rate.
uv run python -m examples.pipechart # qt; or --backend textual, or web
On Qt:
On Textual:
On the web:
It shows:
a line chart: each click on Add Curve plots one curve for the diameter in the form, with its own flow rates;
a gap in a curve: between laminar and turbulent flow neither law holds, so the curve leaves a gap there (a NaN);
scatter series: Add Measurements plots, as dots over the curves, what a test rig measured on that pipe;
a reference line at the pressure of the pump;
tabs: the chart on one tab, and the measurements in a table of records on the Measurements tab, each against the computed drop;
how cells and headers look on the Measurements tab:
the pipe’s cell spans the rows of its measurements;
“Pressure Drop (kPa)” is a header over “Measured” and “Computed”;
a computed drop that the model can’t give (NaN, in transitional flow) is red;
a deviation over 10 % is orange, with a warning mark;
the Kept check box of a NaN row is disabled: that measurement can’t be compared with the model;
a summary under the table shows the measurements kept, with a header before each row;
widgets in cells: the Curves tab lists every curve. A check box shows or hides the curve, and the box in the header shows or hides them all. A combobox draws the curve as a line, in steps, or as dots.
Pipe catalogue
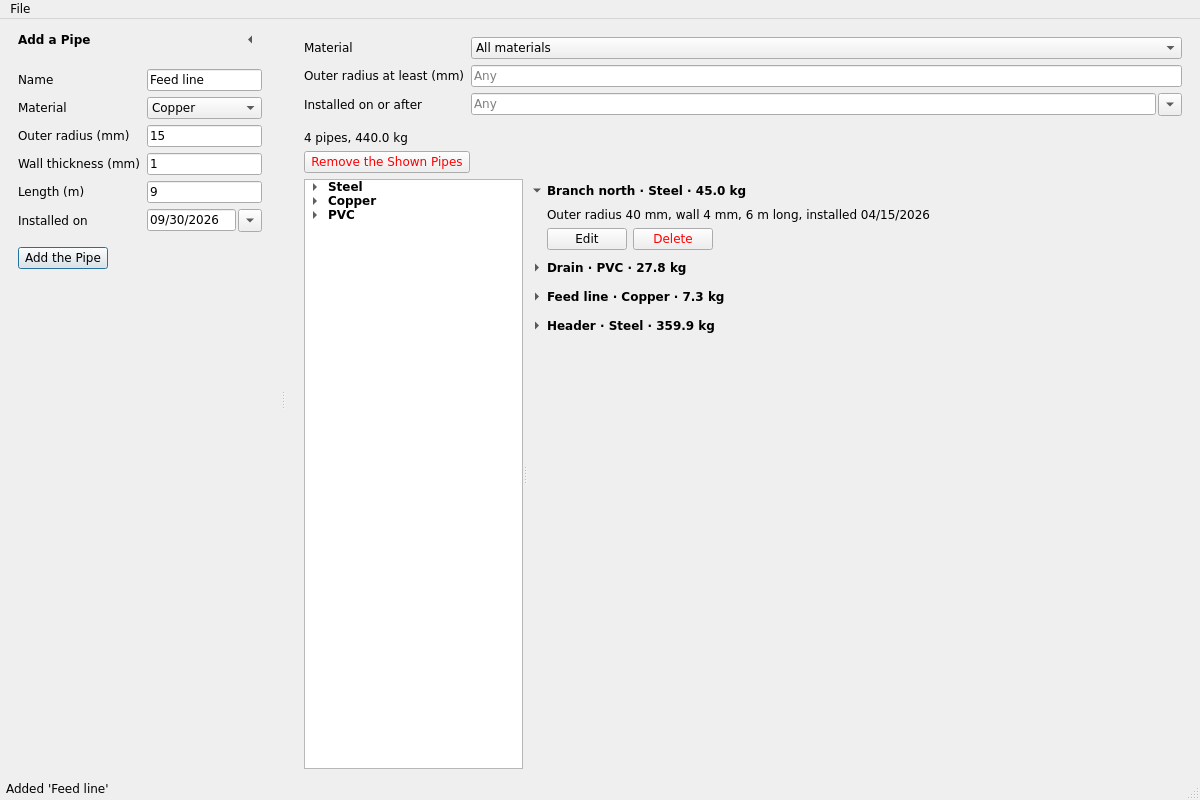
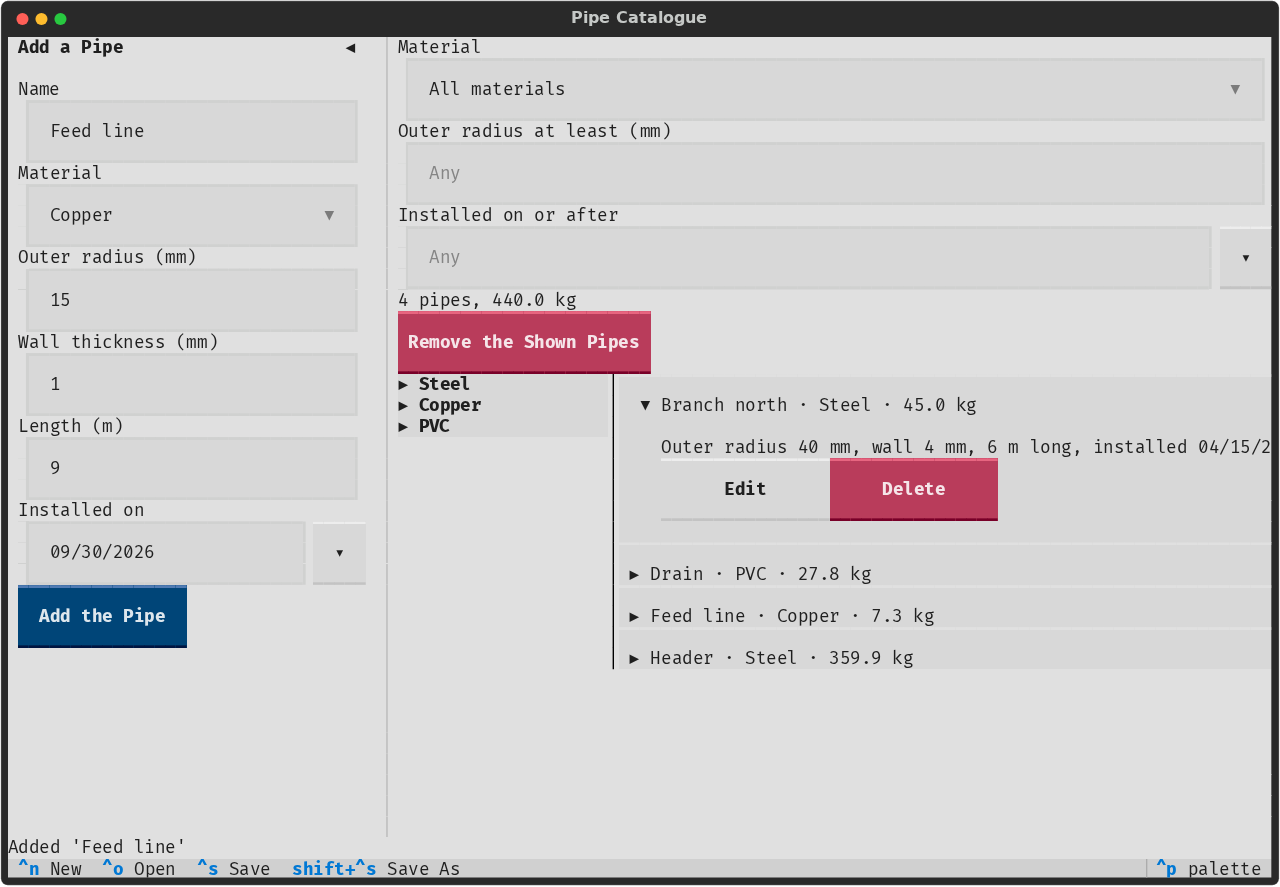
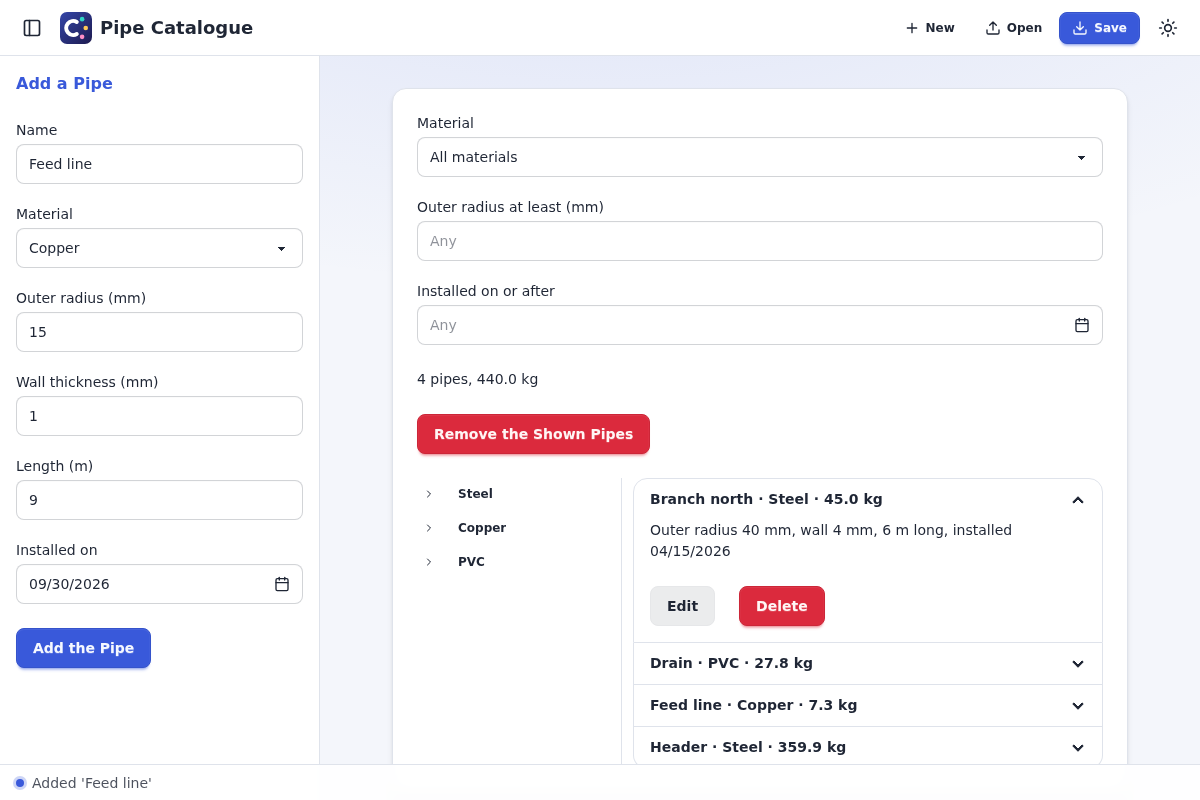
pipecatalogue.py is a catalogue of pipes, kept in a
SQLite database.
uv run python -m examples.pipecatalogue # web; or --backend qt, or textual
On Qt:
On Textual:
On the web:
It shows:
a SQLite model: the pipes are rows of the model’s database, not view state. The database checks every pipe added or changed: a name, positive dimensions, and a wall thinner than the radius. A SQL view computes the mass of each pipe from its material.
a sidebar with a form that adds a pipe;
a list of views: an expander per pipe, with its Edit and Delete buttons. A query filters the list by material, radius, and installation date.
a tree of the pipes by material, beside the list, in resizable panes. The materials are bold. A pipe has a done mark when its installation date is known, and a warning mark until then. When the user selects a pipe in the tree, its expander expands.
a form dialog that edits a pipe. Its Apply button saves the pipe, says so in the dialog, and leaves the dialog open. The dialog checks that no other pipe has the name, and shows why the database refuses a pipe;
a date input for the installation date of a pipe;
studies saved as a
.pipesfile with the views and the database. A study saved before pipes had an installation date gets the column, empty, when it opens, through a migration (PipeCatalogueModel.migrations).
Pipe sweep
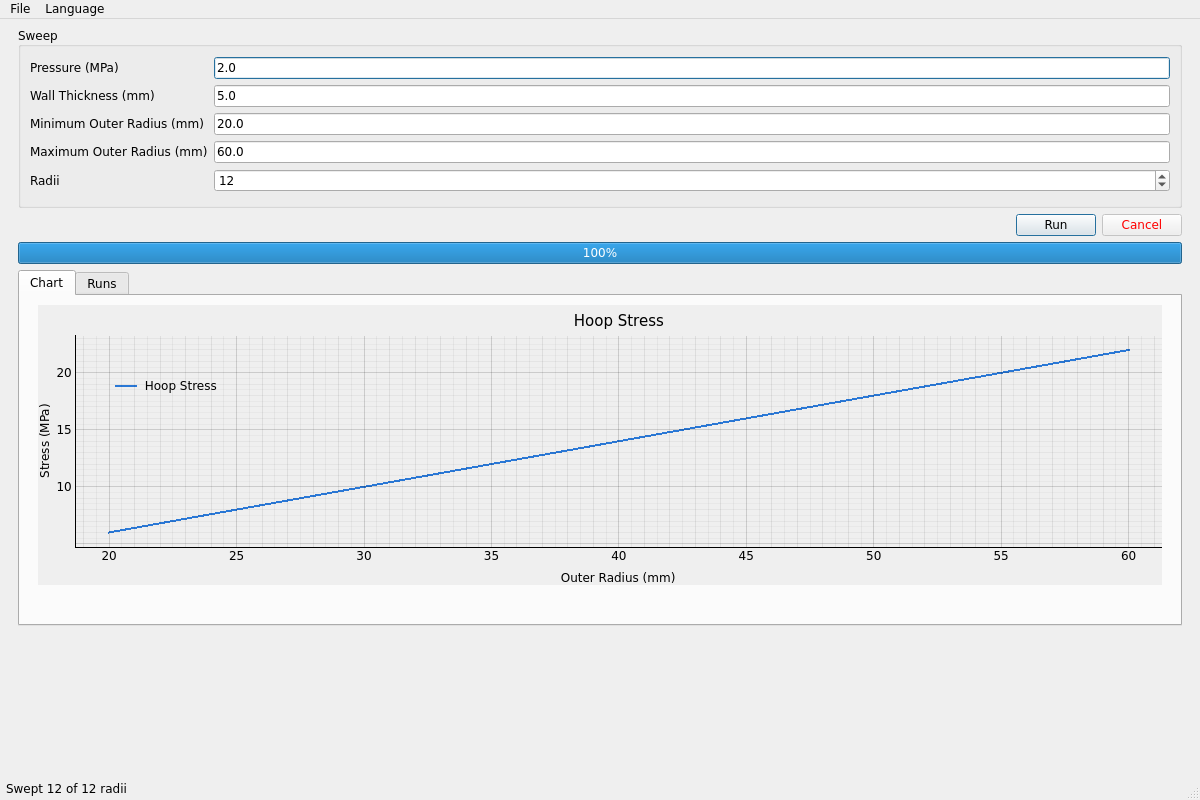
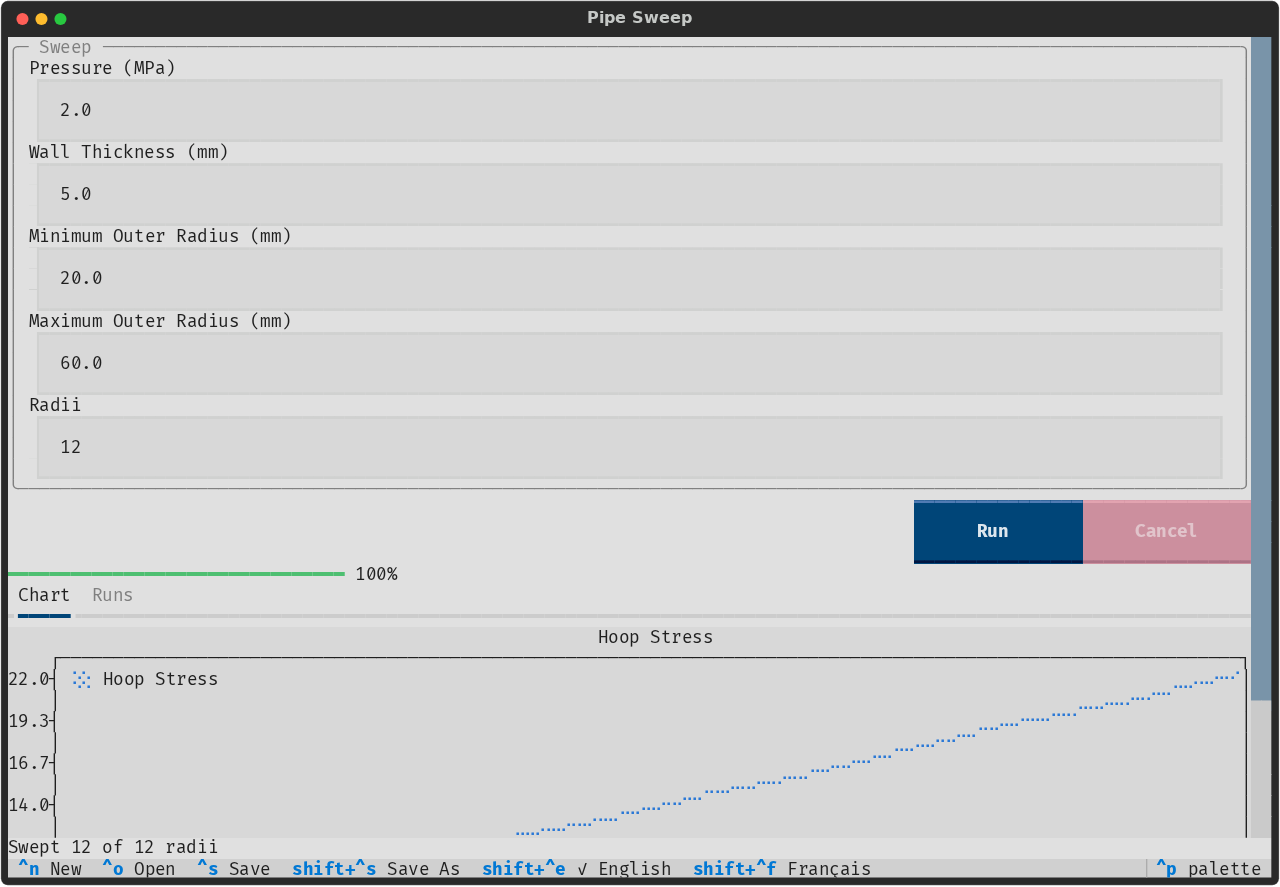
pipesweep.py sweeps the outer radius of a pipe under
pressure, and finds the hoop stress in its wall at each radius.
uv run python -m examples.pipesweep # web; or --backend qt, or textual
On Qt:
On Textual:
On the web:
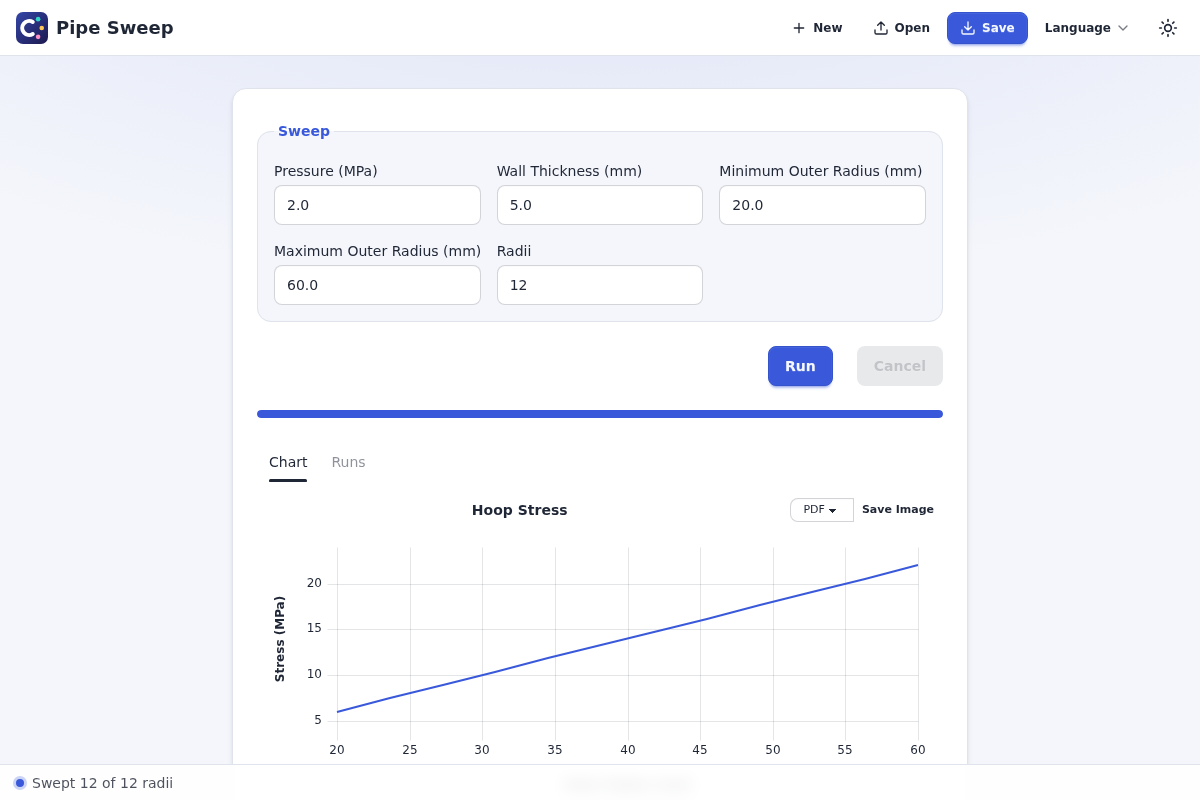
It shows:
a job that works in a thread, one radius at a time, and writes each run to the model’s database when the run is done. The job never touches a view. The
changedsignal of each write is emitted on the main thread, where the views show the runs written so far. Cancel stops the sweep after the current run.a form that checks the sweep before it starts, such as a wall thinner than the minimum radius;
a progress bar of the runs written, and two tabs: a line chart of the runs, and a table of them;
the File menu, which saves and opens the runs with the views as a
.sweepfile;a French translation and a Language menu. To start in French, add
--language fr.
Large table
largetable.py shows a million made-up sensor readings,
kept in SQLite, in a large table.
uv run python -m examples.largetable   # qt; or --backend web, or textual
uv run python -m examples.largetable --rows 100000   # fewer readings, a faster start
On Qt:
On Textual:
On the web:
It shows:
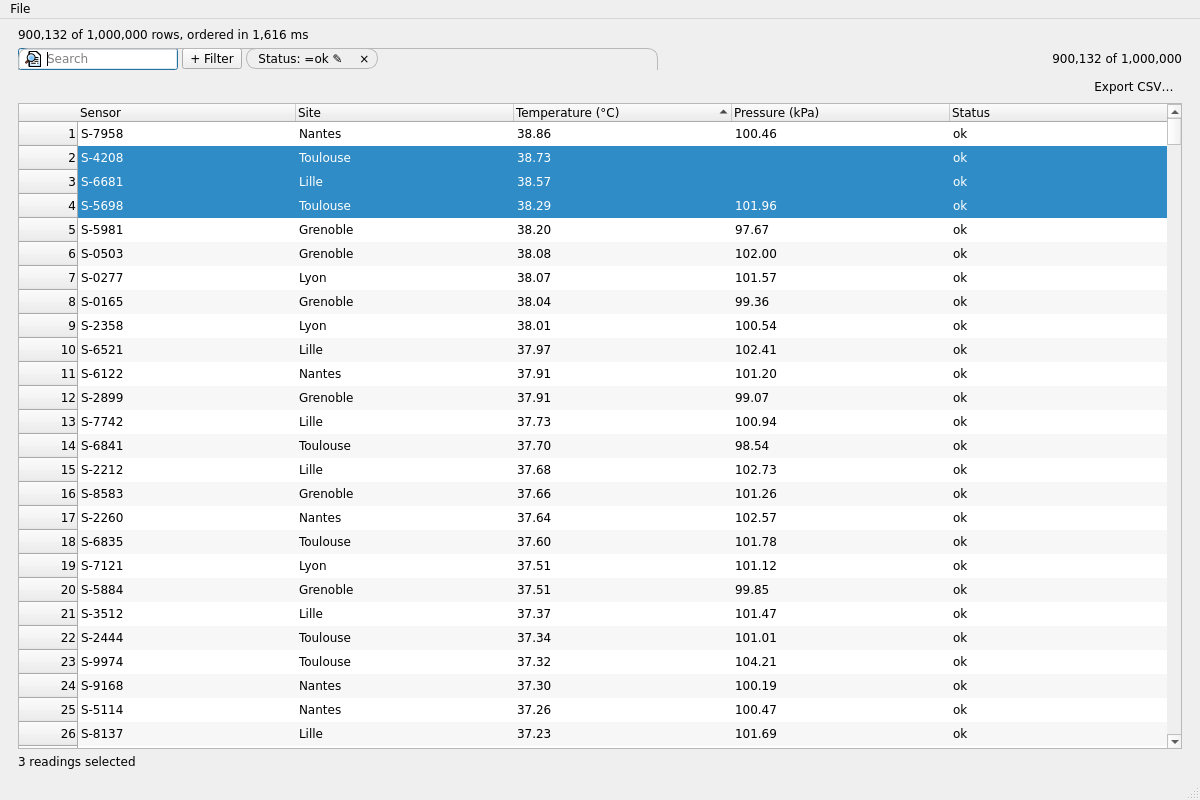
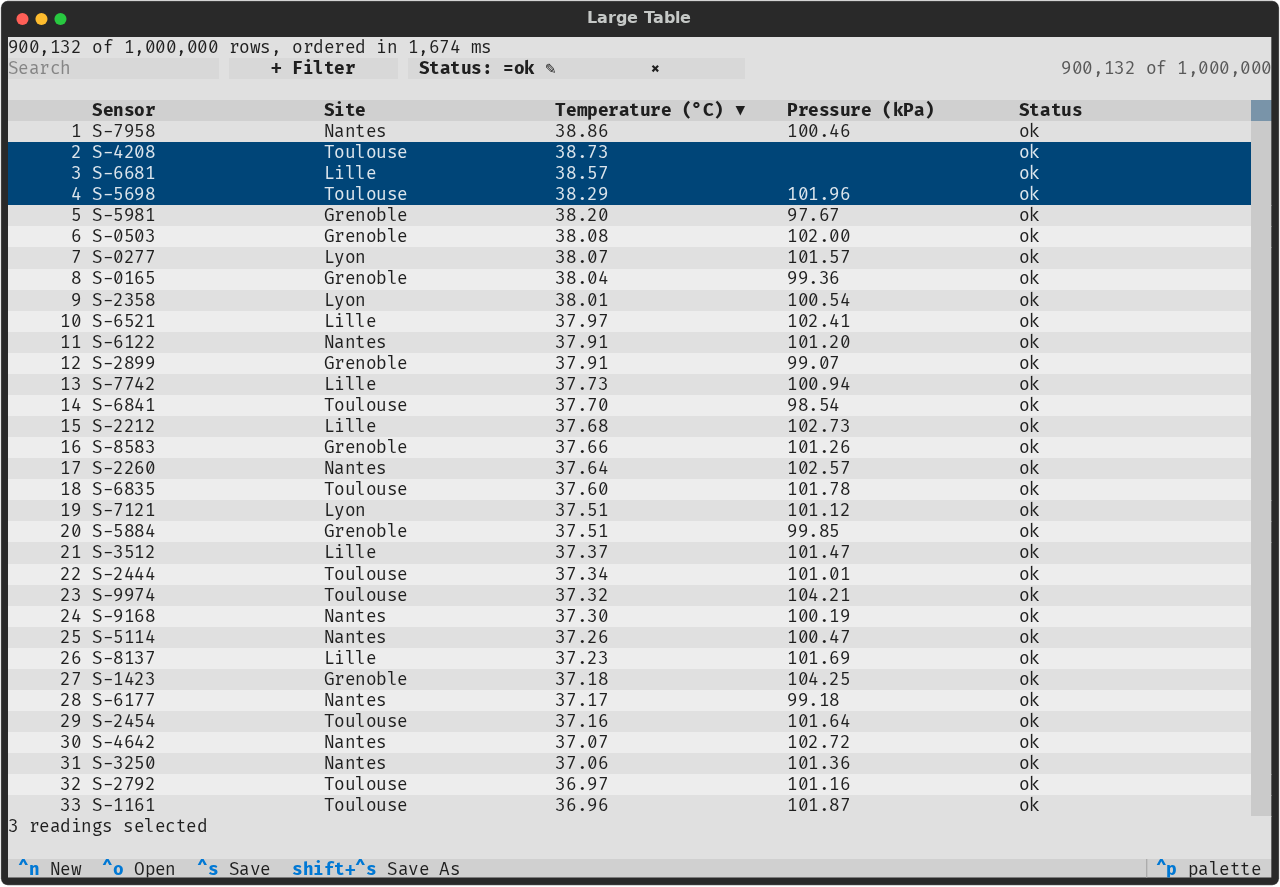
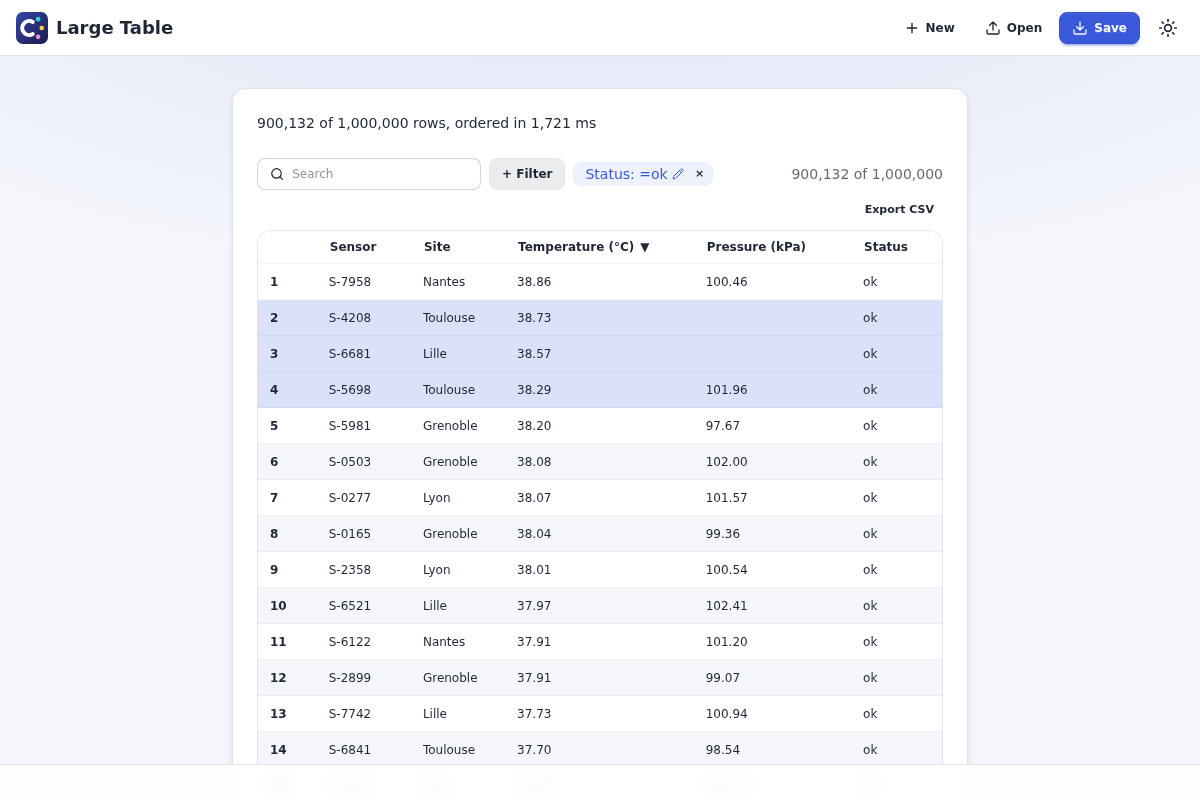
a large table: a
SourceTableViewon aSqliteSourceof the readings. SQLite sorts and filters them, indexed by the columns that sort; each backend draws the rows on screen alone, and reads them as the user scrolls. Python keeps the shown rows’ ids, never the readings.a job writing the readings into the SQLite model, a batch at a time: the window shows at once, and the table fills once they are written.
a sort by a click on a header, and the table’s filter bar: a search in the text columns, and a filter on any column. On Qt and Textual, a job orders the rows, the window staying responsive. The label says how many rows pass and how long SQLite took to order them, once the table’s
orderedemits.a selection of several rows: the label under the table counts them, and shows the reading that a double click or Enter activates. Ctrl+C copies them, to paste in a spreadsheet.
an export of the rows shown to a CSV file: a job writes it on Qt and Textual, and the status bar says when it’s done; the web downloads it.
an option of the app’s own:
--rows, the readings to make up (1,000,000 by default).a study that saves the readings with the model, and the table’s settings with the views. Opened with
-f, it shows its own readings: none are made up.
Uber pickups
uberpickups.py explores the Uber pickups of September 2014
in New York City, after Streamlit’s tutorial.
uv run python -m examples.uberpickups # web; or --backend qt, or textual
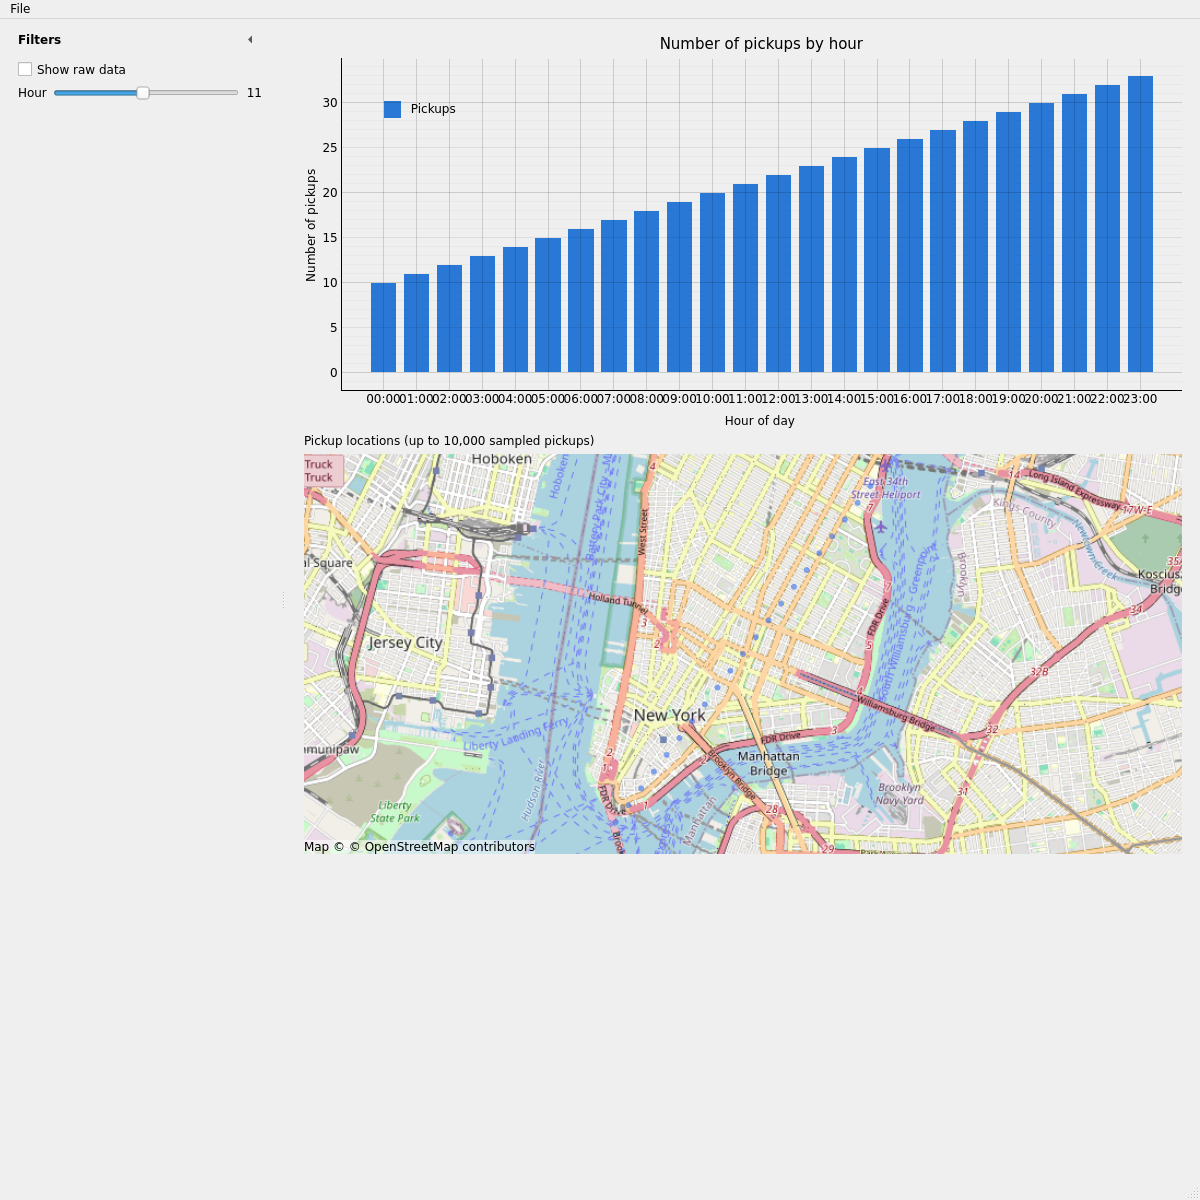
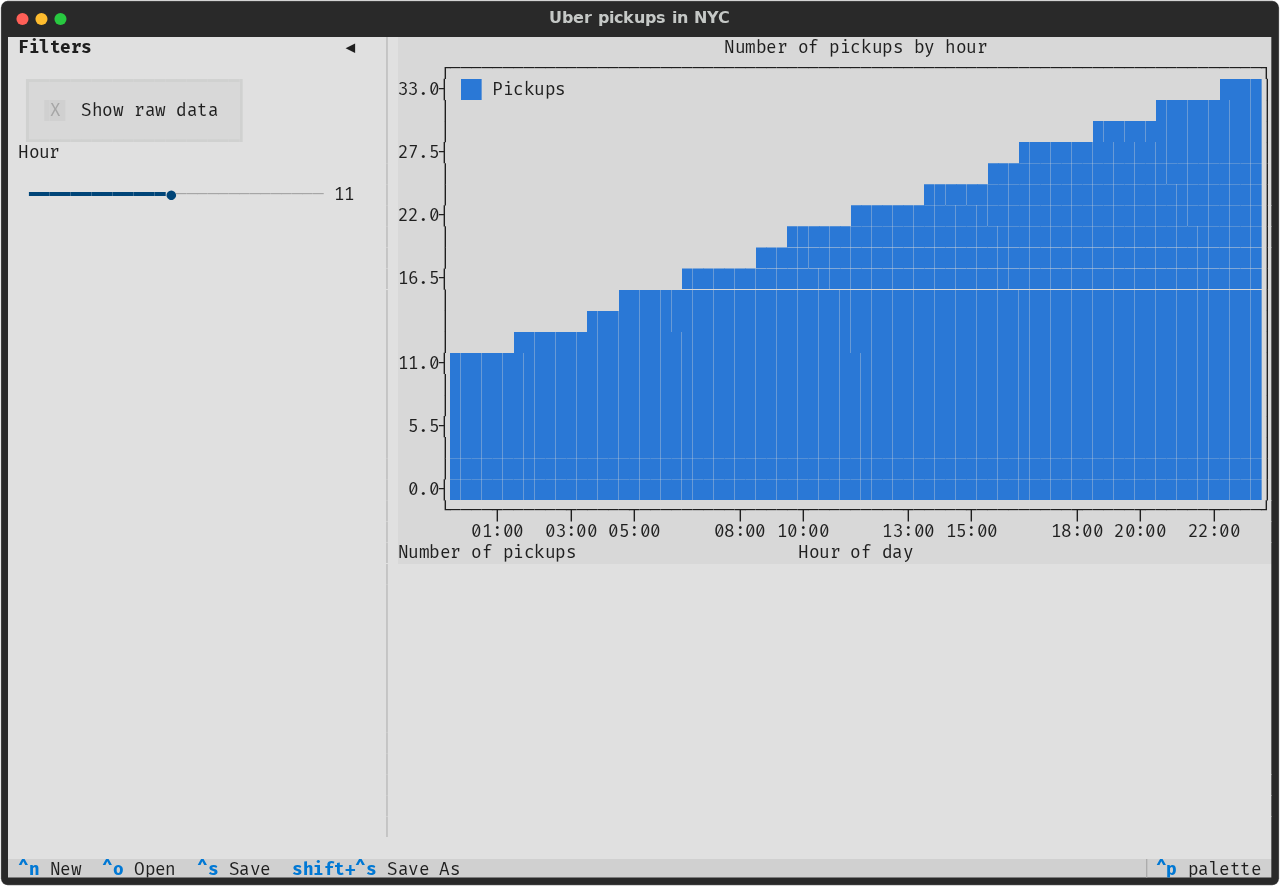
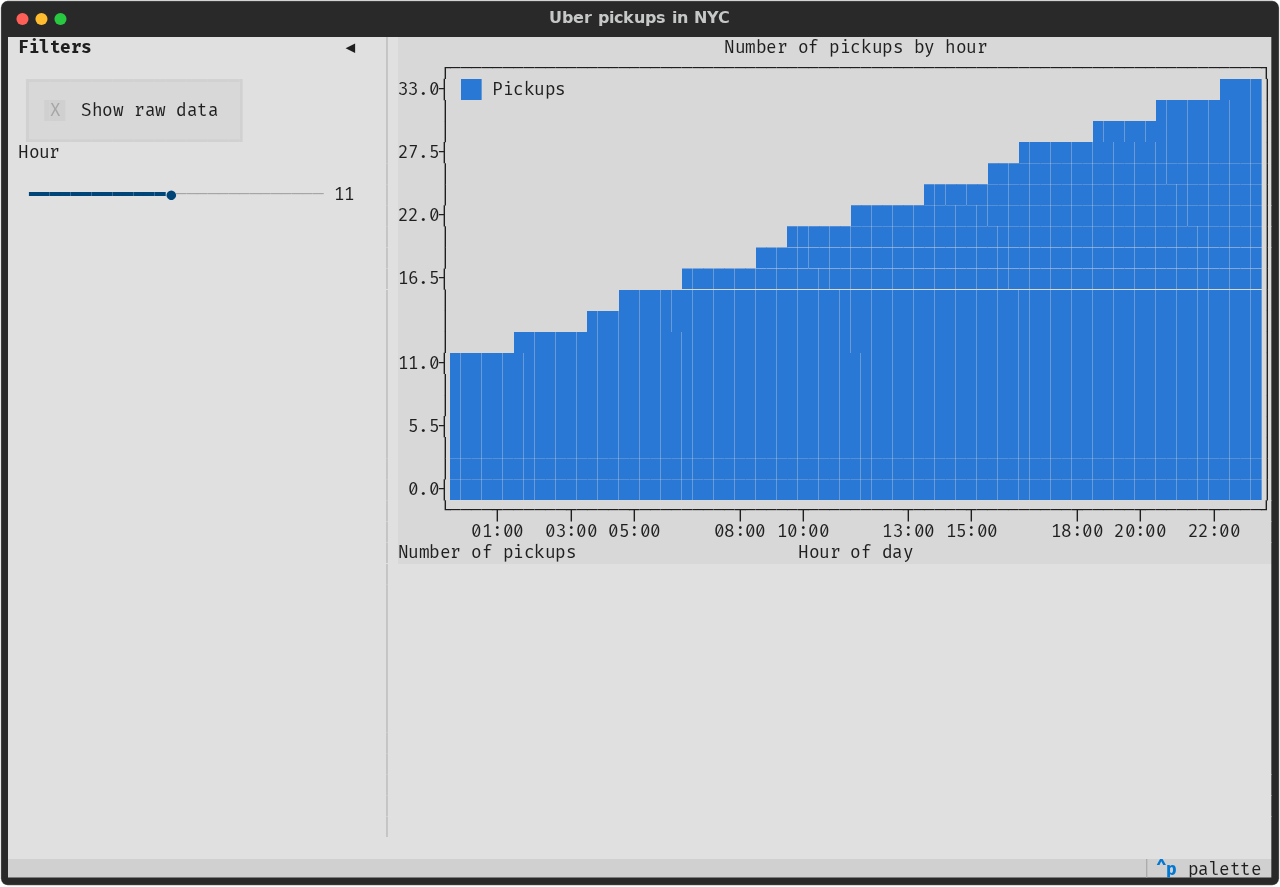
These screenshots use made-up rows. The street map needs a network connection for its tiles. Textual shows no map.
On Qt:
On Textual:
On the web:
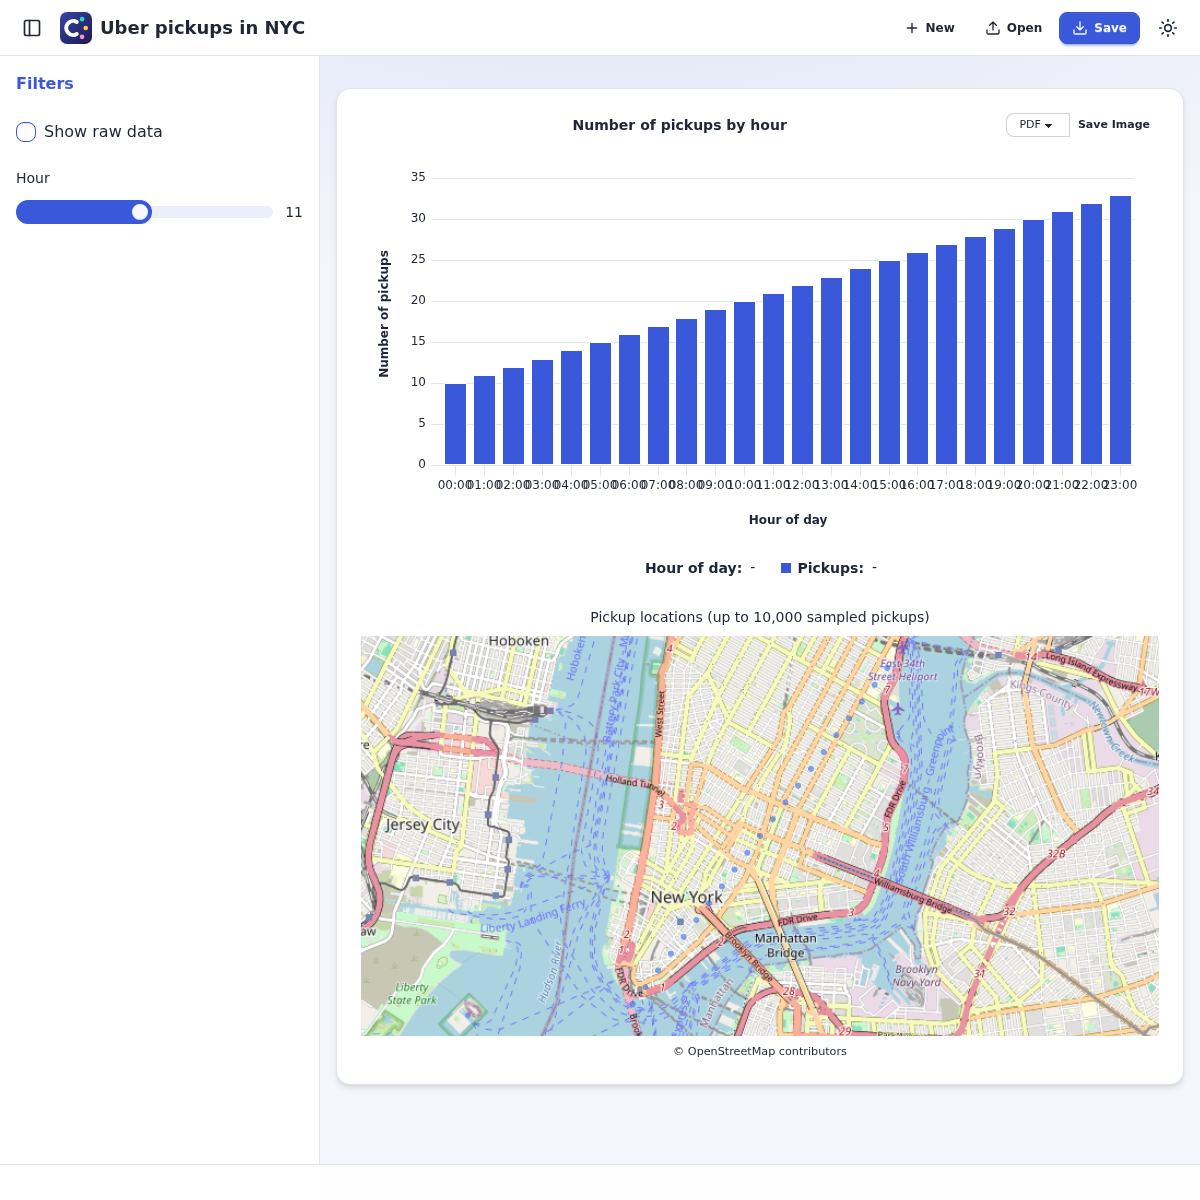
It shows:
a CSV URL imported into a typed SQLite table. The app downloads the CSV file when it first starts. A saved study keeps the rows, so the app does not download them again when the study opens.
a loading task that imports the rows in a job.
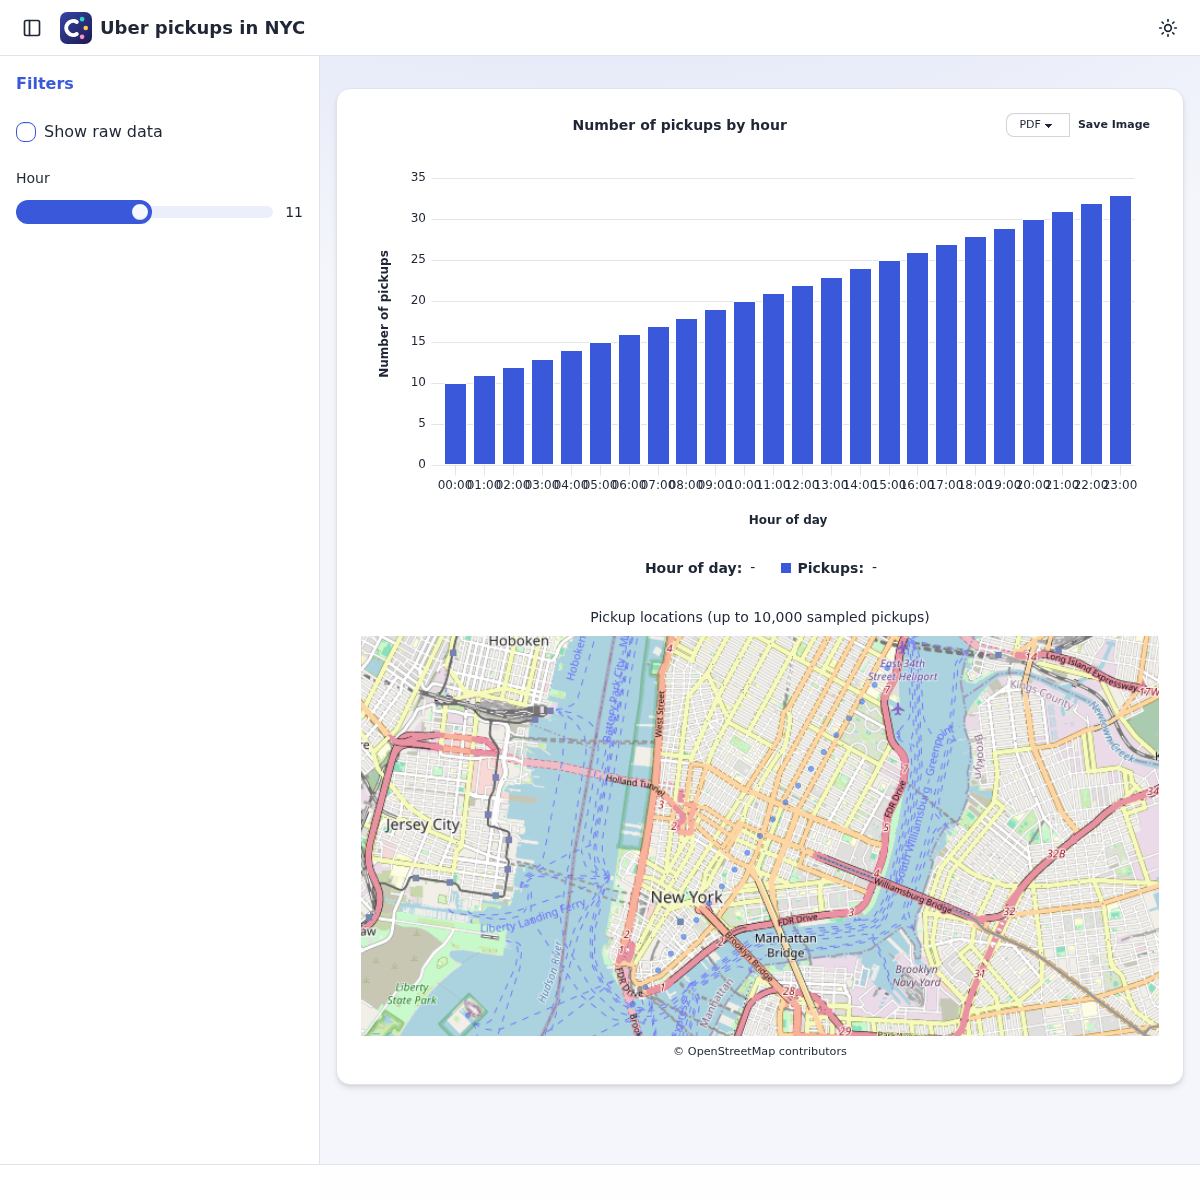
Task.show_stateshows its state in a status line: the count of rows read, or the error. It shows the chart and the map once the task has a result. The task’sfinishedcallback gives them their data.a bar chart of the pickups per hour, which counts all the rows.
bar_chart, fromcomposeui.core.dashboard, sets its kind and its hours.a sidebar of filters: a check box, and a slider of the hour, 11 at the start. The slider is a form row with its label, straight in the sidebar, without a form around it.
a map of the pickups of the slider’s hour, on Qt and the web. The map shows at most 10,000 of them, sampled in the order of the rows. A move of the slider queries the saved rows again for the map only. The map fits the pickups, and keeps the viewport once the user pans or zooms.
a
DashboardView: a wide main view without pages. This one keeps the File menu, so that a study saves the rows.the raw data in a large table, with the rows of all the hours.
CheckBoxMixin.showsshows it only while the sidebar’s check box is checked.
Uber pickups on a dataframe
uberpickupsframe.py is the
Uber pickups app, with its rows in a Polars frame instead of SQLite.
uv run python -m examples.uberpickupsframe # web; or --backend qt, or textual
It needs the dataframe extra and Polars. It reads the CSV file in a job each time that it
starts. It has no File menu, because a study would keep no rows. The table shows the CSV’s
own columns. Polars counts the pickups by hour, and samples the pickups of the slider’s hour
for the map.
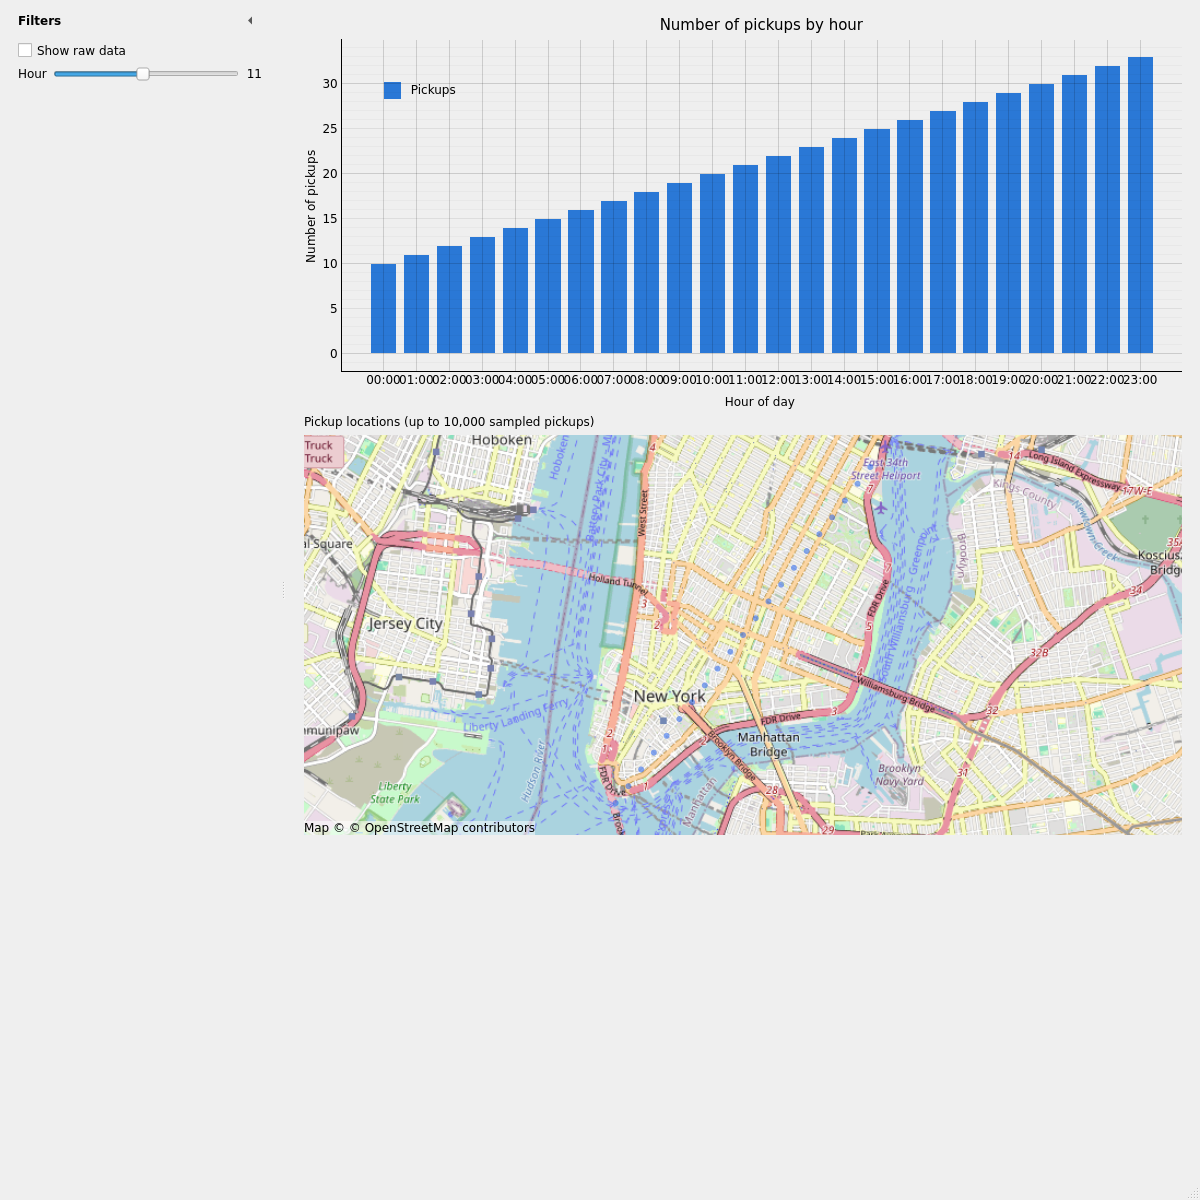
These screenshots use made-up rows. The street map needs a network connection for its tiles. Textual shows no map.
On Qt:
On Textual:
On the web:
It shows:
a large table on a
DataFrameSource: Polars sorts, searches, and filters a million pickups;a job that only reads the CSV file. Its result, a frame, becomes the table’s source on the main thread.
the status line, the chart, the map, and the sidebar of Uber pickups. The chart’s series comes from
Series.bars, and the map’s points from the frame, withpoints_of.
Batman
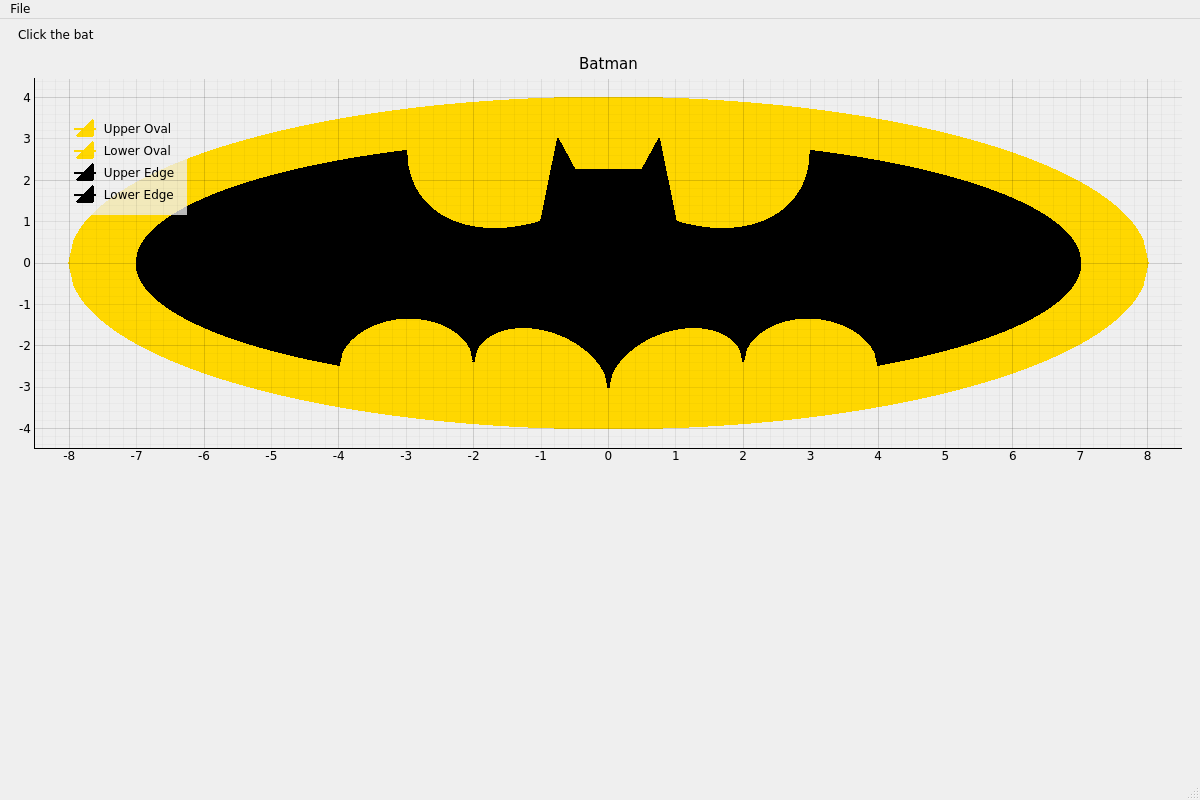
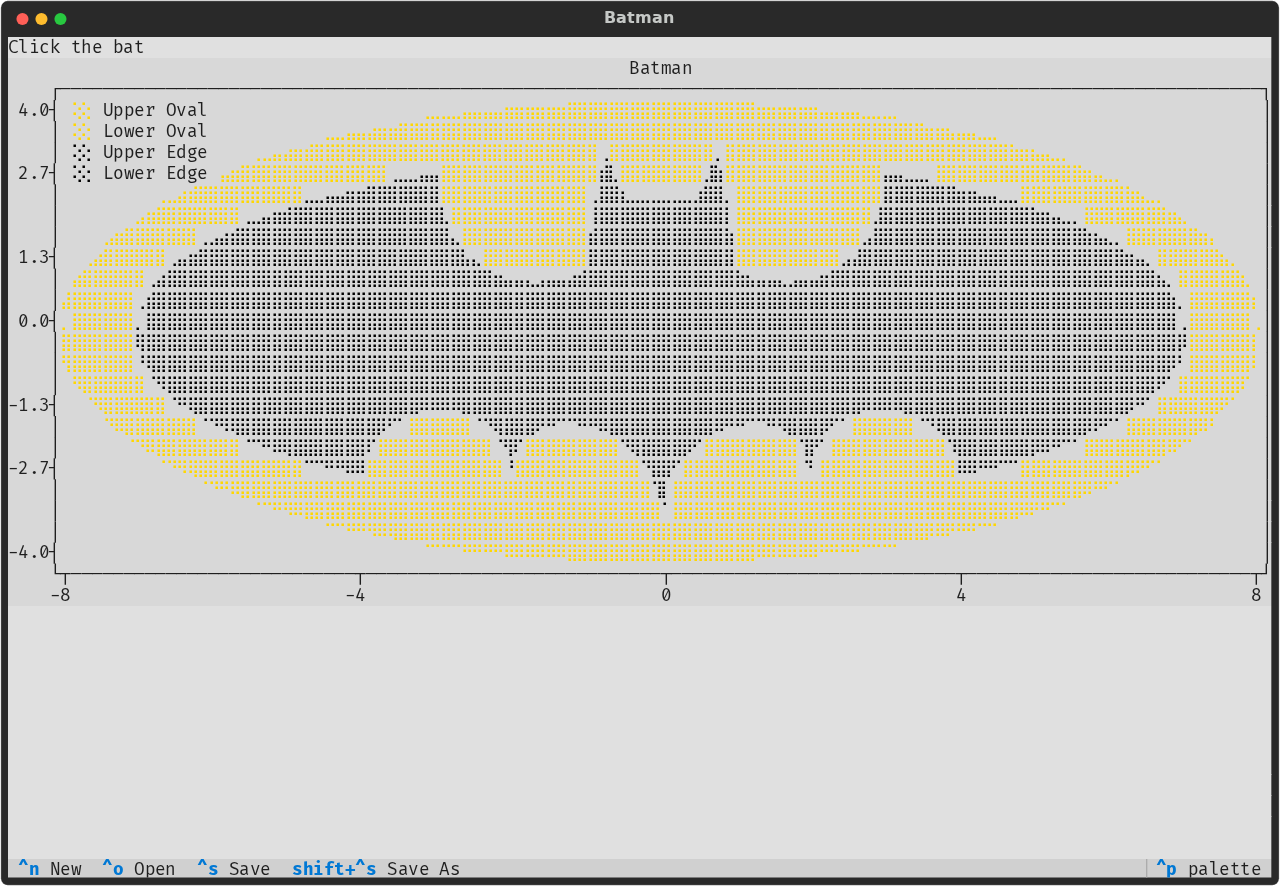
batman.py draws the Batman logo on a chart.
uv run python -m examples.batman # qt; or --backend web, or textual
On Qt:
On Textual:
On the web:
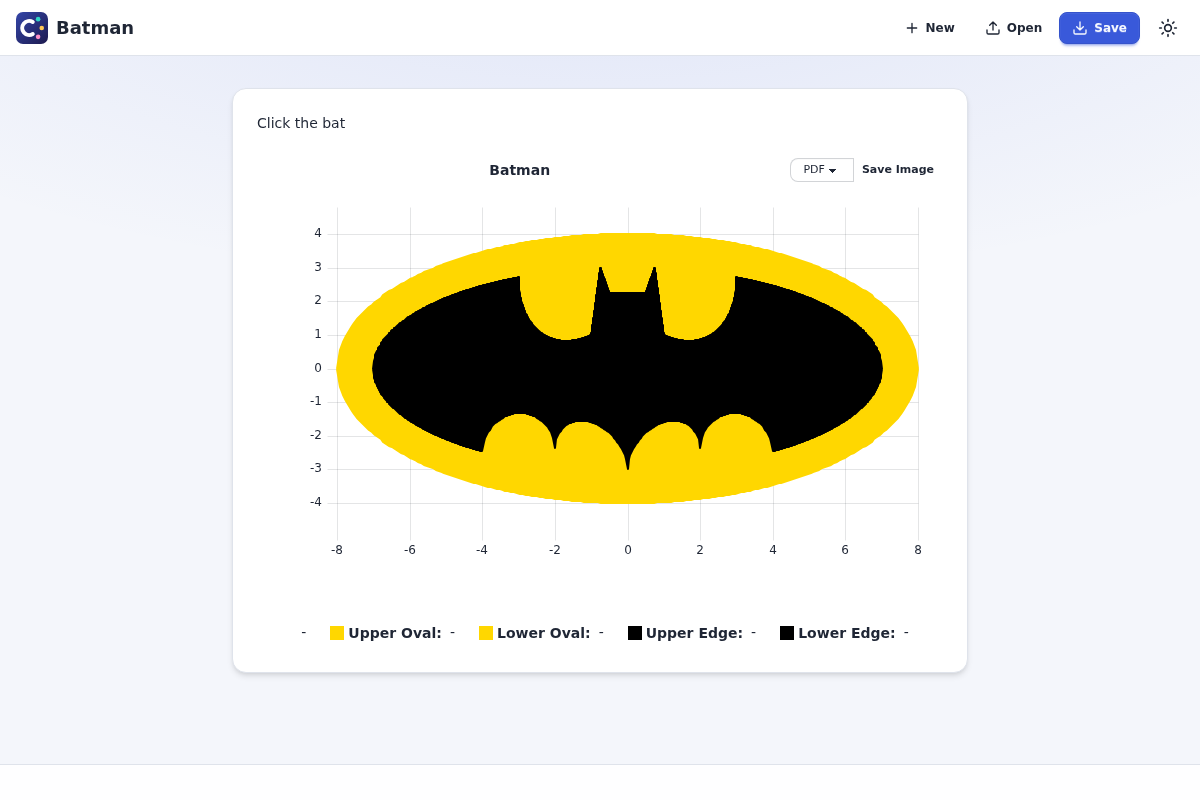
It shows:
series colors and fills: a yellow oval and the edges of the bat in black, each series in the color of the logo, whatever the theme;
clicks on a chart:
clickedemits the point, and the view says whether it is on the bat. Textual draws the logo too, but a terminal has no pointer to click it with.
Web hello
webhello.py is a small form on the
web backend only.
uv run python -m examples.webhello
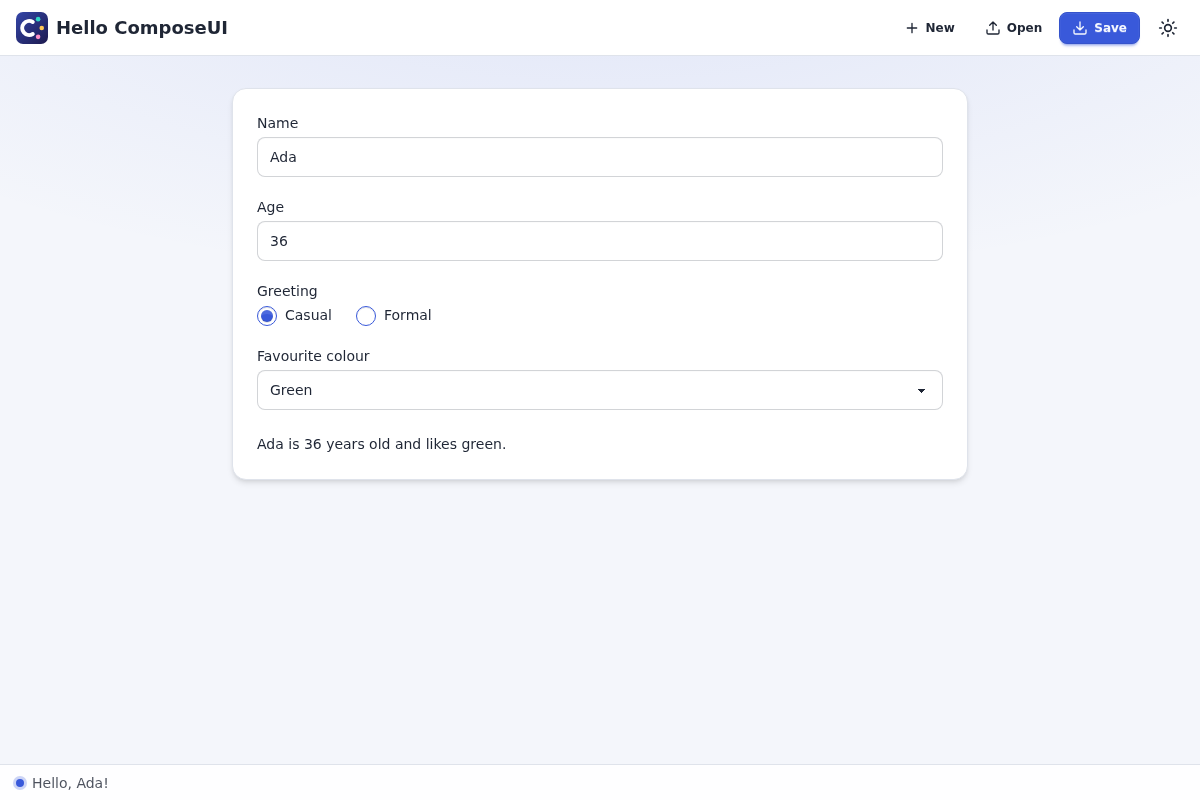
It serves http://127.0.0.1:8000. It shows:
an application built as a
WebApplicationsubclass, withoutrun;a form with a text input, a float input, a radio group, and a combobox, with validation on the name and the age;
one keystroke that updates the status bar, the log of the row, and a summary label at once.
Textual demo
textual_demo.py is a small form in a terminal.
uv run python -m examples.textual_demo
On Qt:
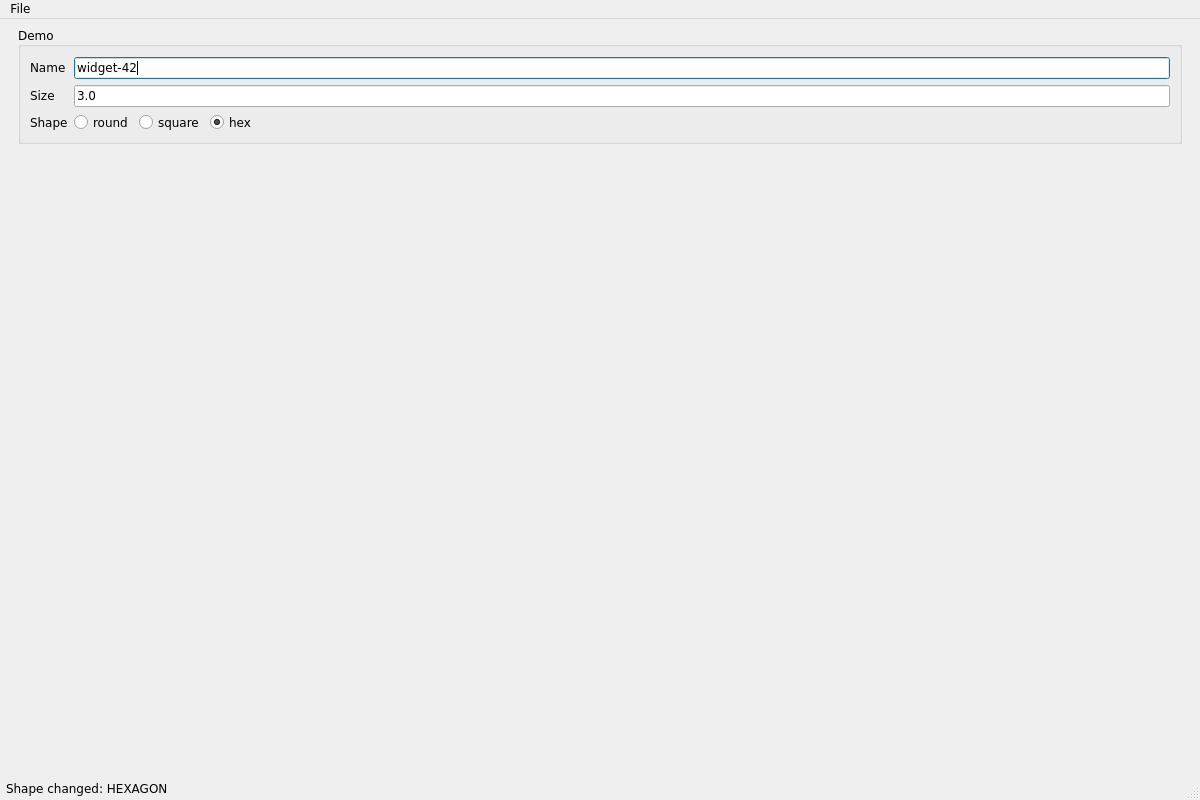
On Textual:
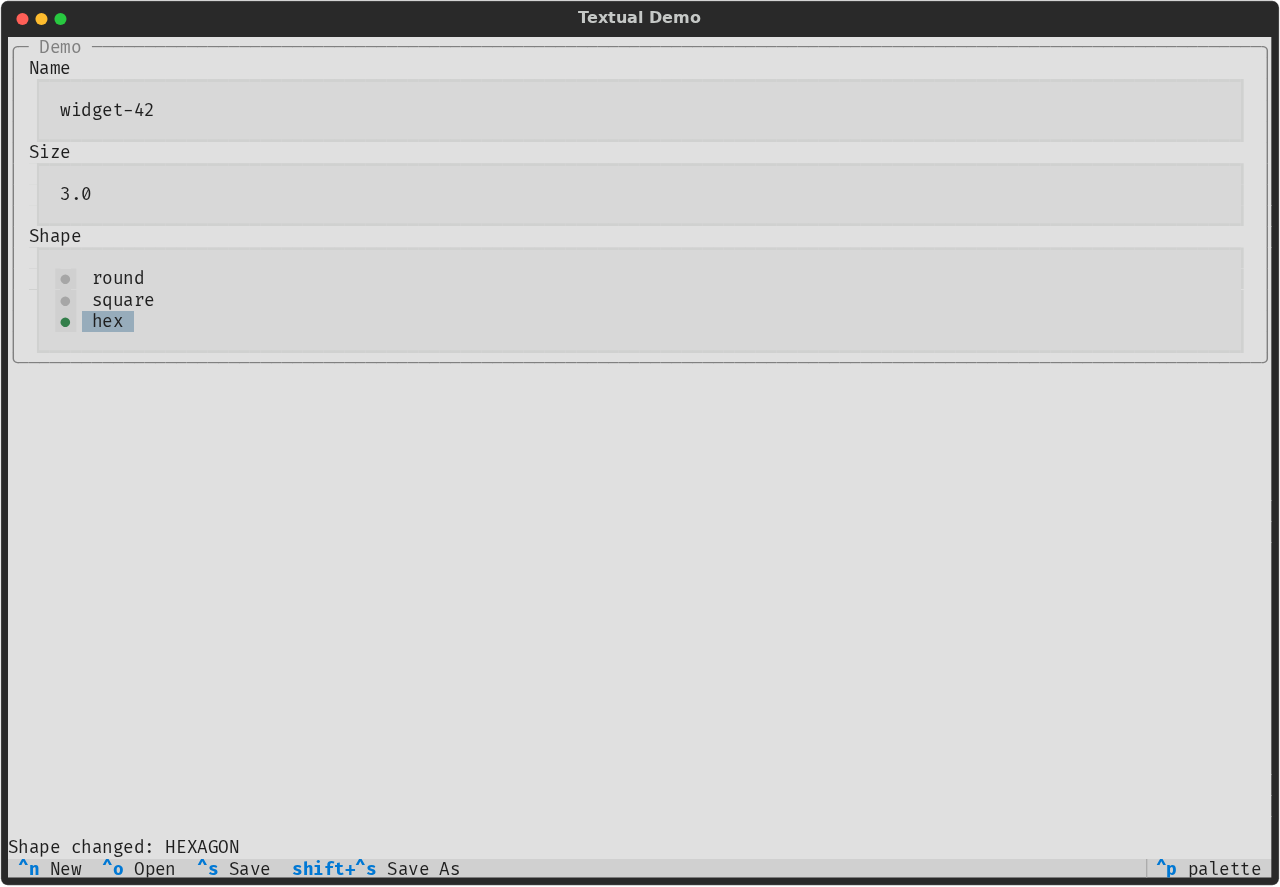
On the web:
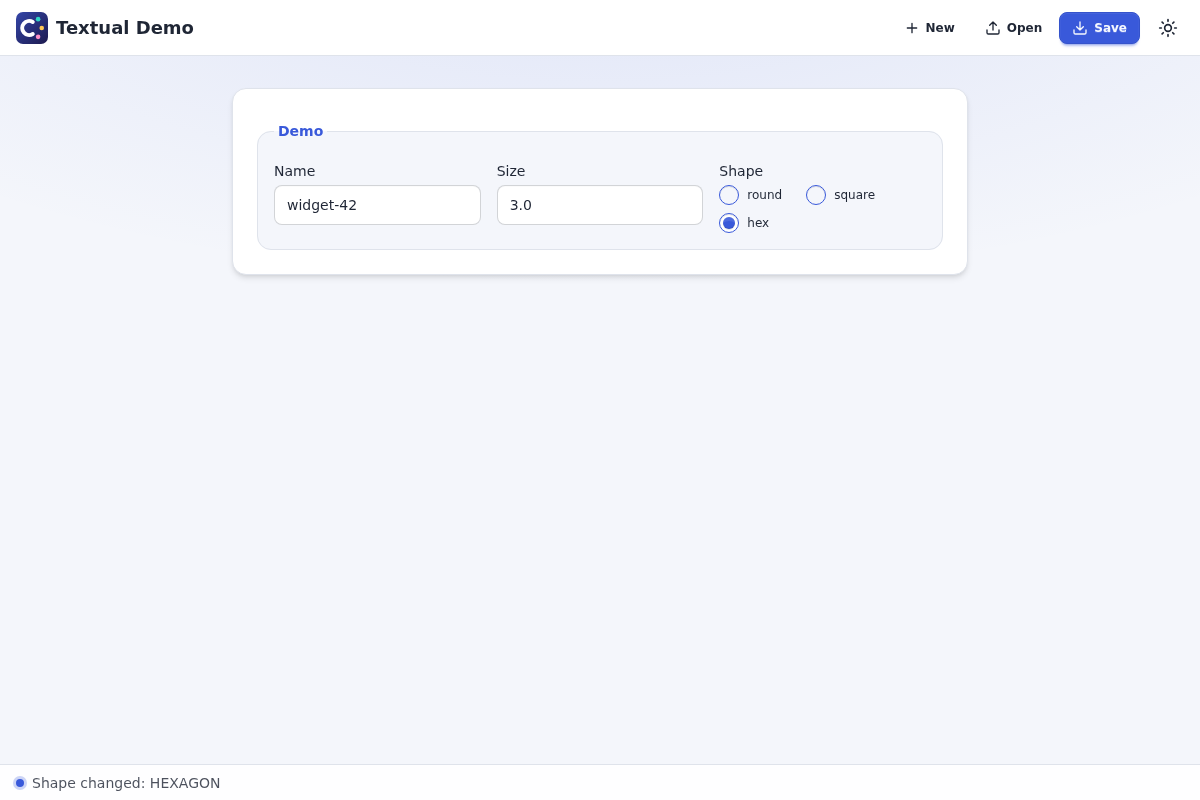
It shows a form with a text input, a float input, and a radio group. A change of shape
shows a message in the status bar. It starts on Textual: run(..., default_backend=RendererType.TEXTUAL).